HOT TOPICS LIST
- MACD
- Fibonacci
- RSI
- Gann
- ADXR
- Stochastics
- Volume
- Triangles
- Futures
- Cycles
- Volatility
- ZIGZAG
- MESA
- Retracement
- Aroon
INDICATORS LIST
LIST OF TOPICS
PRINT THIS ARTICLE
by Austin Passamonte
Here's the midterm price analysis of crude oil (CL) futures.
Position: N/A
Austin Passamonte
Austin is a private trader who trades emini stock index futures intraday. He currently trades various futures markets from home in addition to managing a trader's educational forum
PRINT THIS ARTICLE
TECHNICAL ANALYSIS
Leveled Off In Crude
06/14/10 01:47:59 PMby Austin Passamonte
Here's the midterm price analysis of crude oil (CL) futures.
Position: N/A
| Depending on whose data and stats we are given, the tragic oil well leak in the Gulf Of Mexico has been staunched to some degree. The permanent fix and completed full attention turn to long-term environmental cleanup from there. |

|
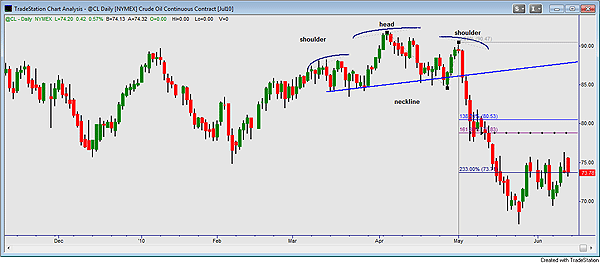
| FIGURE 1: CL, DAILY |
| Graphic provided by: TradeStation. |
| |
| On a purely technical analysis level, crude oil futures broke down from the bearish head & shoulders pattern we noted (Figure 1). From there the contract made a measured drop to midlevel Fibonacci projected extension zones; 233% and 377% of noted 1-2-3 price patterns are often fulfulled. In this specific case, 377% is near the 63.60 zone of current continuous contract measure. Target subject to change with further front-month contract rollover to come. |

|
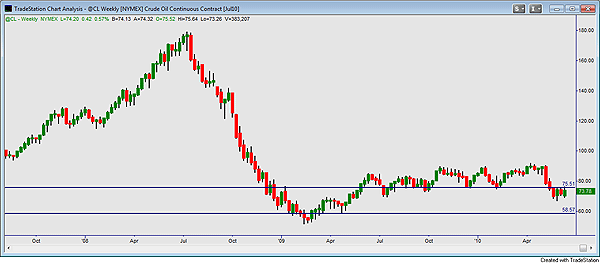
| FIGURE 2: CL, WEEKLY |
| Graphic provided by: TradeStation. |
| |
| Figure 2, a weekly chart view, shows CL with (at least) two horizontal zones of congestion magnets. The present 75.50 zone has been in play for weekly support lows since back in early June 2009, one year ago. Price briefly slipped below on weekly closing basis two times since, and both quickly recovered higher the following week. This time, we see four consecutive weeks closed below that long-term mark. |

|
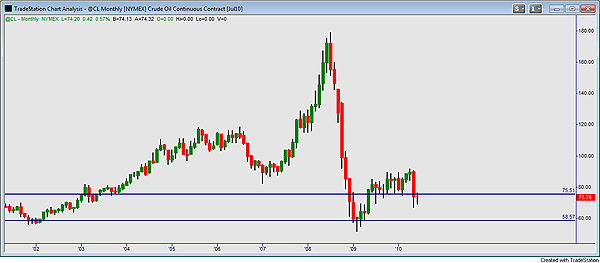
| FIGURE 3: CL, MONTHLY |
| Graphic provided by: TradeStation. |
| |
| As noted numerous times before, crude oil is a complex blend of consumer commodity and quasicurrency market. Various weighting of supply/demand pricing, OPEC pinning and US dollar fluctuation can at any point press greater influence than another. "Fair value" of crude oil is said to be based purely on supply/demand pressure as a consumer product would be priced somewhere in the $40 to $50 bbl range. See Figure 3 for a monthly view. |
| Hedge-fund speculations drove CL pricing to all-time nosebleed highs back in early 2008. The dramatic ascent and more dramatic collapse correction back then had little to do with fair-value of oil. It had everything to do with valuation of future supply projections and at-the-time USD pricing adjustments. No reason in the world why CL cannot and will not form a new long-term base below $60 bbl ahead. Unless the USD reverts to hard-core selling pressure soon, the trend direction of CL futures remains down -- possibly dramatic fashion, again. |
Austin is a private trader who trades emini stock index futures intraday. He currently trades various futures markets from home in addition to managing a trader's educational forum
| Title: | Individual Trader |
| Company: | CoiledMarkets.com |
| Address: | PO Box 633 |
| Naples, NY 14512 | |
| Website: | coiledmarkets.com/blog |
| E-mail address: | austinp44@yahoo.com |
Traders' Resource Links | |
| CoiledMarkets.com has not added any product or service information to TRADERS' RESOURCE. | |
Click here for more information about our publications!
Comments
Date: 06/15/10Rank: 3Comment:

Request Information From Our Sponsors
- StockCharts.com, Inc.
- Candle Patterns
- Candlestick Charting Explained
- Intermarket Technical Analysis
- John Murphy on Chart Analysis
- John Murphy's Chart Pattern Recognition
- John Murphy's Market Message
- MurphyExplainsMarketAnalysis-Intermarket Analysis
- MurphyExplainsMarketAnalysis-Visual Analysis
- StockCharts.com
- Technical Analysis of the Financial Markets
- The Visual Investor
- VectorVest, Inc.
- Executive Premier Workshop
- One-Day Options Course
- OptionsPro
- Retirement Income Workshop
- Sure-Fire Trading Systems (VectorVest, Inc.)
- Trading as a Business Workshop
- VectorVest 7 EOD
- VectorVest 7 RealTime/IntraDay
- VectorVest AutoTester
- VectorVest Educational Services
- VectorVest OnLine
- VectorVest Options Analyzer
- VectorVest ProGraphics v6.0
- VectorVest ProTrader 7
- VectorVest RealTime Derby Tool
- VectorVest Simulator
- VectorVest Variator
- VectorVest Watchdog
