HOT TOPICS LIST
- MACD
- Fibonacci
- RSI
- Gann
- ADXR
- Stochastics
- Volume
- Triangles
- Futures
- Cycles
- Volatility
- ZIGZAG
- MESA
- Retracement
- Aroon
INDICATORS LIST
LIST OF TOPICS
PRINT THIS ARTICLE
by Koos van der Merwe
When the market is depressing you, calm your mind by mediating with yoga ... and yoga clothes.
Position: Accumulate
Koos van der Merwe
Has been a technical analyst since 1969, and has worked as a futures and options trader with First Financial Futures in Johannesburg, South Africa.
PRINT THIS ARTICLE
TRIANGLES
Lulling Your Stock Nerves With Lululemon
06/14/10 09:13:29 AMby Koos van der Merwe
When the market is depressing you, calm your mind by mediating with yoga ... and yoga clothes.
Position: Accumulate
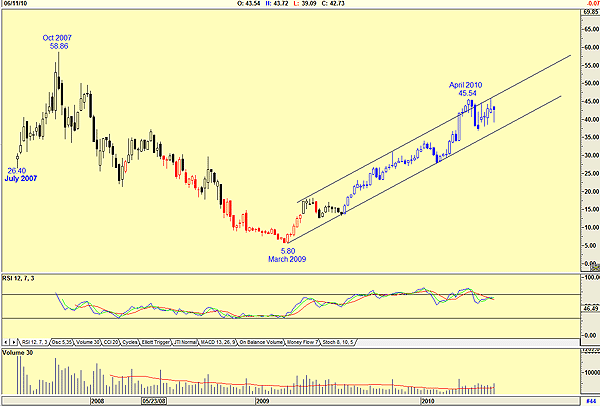
| To do that, you'd have to visit Lululemon to buy your yoga outfit. Why else has the share price of the company moved upward against the market trend? Lululemon Athletic offers yoga-inspired apparel. The company manufactures clothing for yoga, dancing, running, and most other sweaty pursuits. They advertise that they "create components for people to live longer, healthier and more fun lives." Lululemon was founded in Vancouver, BC, in 1998. The first Lululemon store shared its retail space with a yoga studio and they have been growing ever since. Their yoga clothes and apparel are now sold at more than 100 stores across Canada, the US, Australia, and Hong Kong. See Figure 1. |

|
| FIGURE 1: LULULEMON, WEEKLY |
| Graphic provided by: AdvancedGET. |
| |
| The company came to the market in July 2007 at $26.40 and quickly climbed to a high of $58.86 by October 2007. It then fell along with the rest of the market to a low of $5.80 by March 2009. Since then, the share price has risen in a classic V-shaped recovery, to $45.54 by April 2010. The stock price has since paused, moving sideways rather than falling along with the general market. The relative strength index (RSI), however, is suggesting weakness ahead. |

|
| FIGURE 2: LULULEMON, DAILY |
| Graphic provided by: AdvancedGET. |
| |
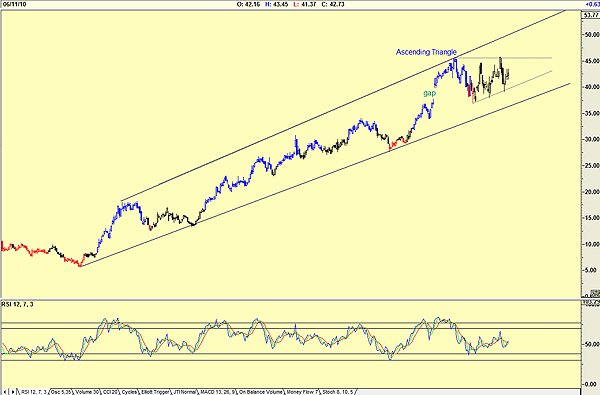
| Figure 2, the daily chart, shows how the price moved sideways, forming an ascending triangle as the index fell during May. An ascending triangle occurs when demand is growing and meets supply at a fixed price. Should the demand continue, the supply being distributed at that price will eventually be absorbed by new buyers, and the price will rapidly advance. Prices should rally to meet the upper trendline shown on the chart. Do note how the price did fall to fill the gap. Note, too, that the RSI is suggesting a possible buy. The ascending triangle that is being formed by Lululemon does suggest that should the market recover, as expected, then the share price will move up strongly possibly to the $51 to $52 level. I would be a buyer on any retracement. |
Has been a technical analyst since 1969, and has worked as a futures and options trader with First Financial Futures in Johannesburg, South Africa.
| Address: | 3256 West 24th Ave |
| Vancouver, BC | |
| Phone # for sales: | 6042634214 |
| E-mail address: | petroosp@gmail.com |
Click here for more information about our publications!
Comments

Request Information From Our Sponsors
- StockCharts.com, Inc.
- Candle Patterns
- Candlestick Charting Explained
- Intermarket Technical Analysis
- John Murphy on Chart Analysis
- John Murphy's Chart Pattern Recognition
- John Murphy's Market Message
- MurphyExplainsMarketAnalysis-Intermarket Analysis
- MurphyExplainsMarketAnalysis-Visual Analysis
- StockCharts.com
- Technical Analysis of the Financial Markets
- The Visual Investor
- VectorVest, Inc.
- Executive Premier Workshop
- One-Day Options Course
- OptionsPro
- Retirement Income Workshop
- Sure-Fire Trading Systems (VectorVest, Inc.)
- Trading as a Business Workshop
- VectorVest 7 EOD
- VectorVest 7 RealTime/IntraDay
- VectorVest AutoTester
- VectorVest Educational Services
- VectorVest OnLine
- VectorVest Options Analyzer
- VectorVest ProGraphics v6.0
- VectorVest ProTrader 7
- VectorVest RealTime Derby Tool
- VectorVest Simulator
- VectorVest Variator
- VectorVest Watchdog
