HOT TOPICS LIST
- MACD
- Fibonacci
- RSI
- Gann
- ADXR
- Stochastics
- Volume
- Triangles
- Futures
- Cycles
- Volatility
- ZIGZAG
- MESA
- Retracement
- Aroon
INDICATORS LIST
LIST OF TOPICS
PRINT THIS ARTICLE
by Ron Walker
A series of bullish candlesticks hints that we may have reached capitulation and that the market could be setting up a double-bottom pattern.
Position: N/A
Ron Walker
Ron Walker is an active trader and technical analyst. He operates an educational website dedicated to the study of Technical Analysis. The website offers free market analysis with daily video presentations and written commentaries. Ron is a video pioneer, being one of the first to utilize the internet producing Technical Analysis videos. His website is thechartpatterntrader.com
PRINT THIS ARTICLE
CANDLESTICK CHARTING
Bullish Belt Holds Bolster A Bottom
06/11/10 09:16:07 AMby Ron Walker
A series of bullish candlesticks hints that we may have reached capitulation and that the market could be setting up a double-bottom pattern.
Position: N/A
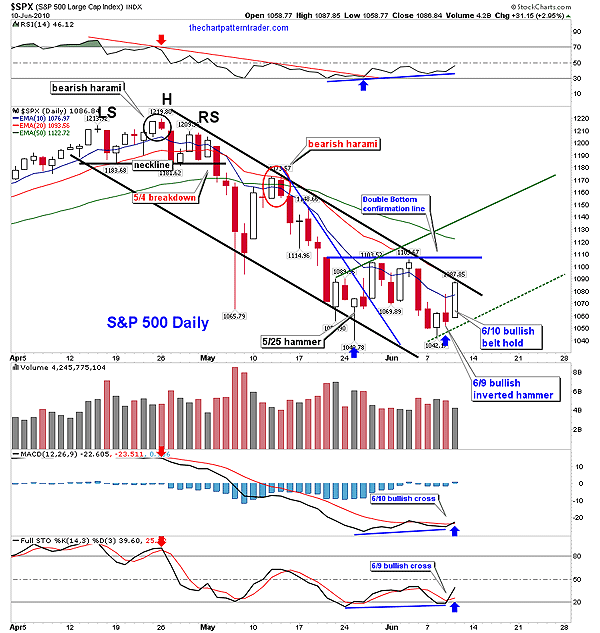
| The daily chart of the Standard & Poor's 500 peaked on April 26, 2010, with an intraday high of 1219. There, a bearish harami candle pattern formed in the head of a small head & shoulders topping pattern that developed during April and was completed in the early part of May (Figure 1). The pattern broke down on May 4 as prices dropped below the neckline of the pattern. The S&P 500 produced a lower high and a lower low, transitioning into a falling price channel. |

|
| FIGURE 1: $SPX,DAILY. An Adam & Eve double bottom combines one narrow and one wide bottom. The Adam bottom got a one-day downward price spike, while the Eve bottom takes on a U-shape. Prices now need to catapult above the declining trendline and surge above the double-bottom confirmation line, which is overhead resistance. |
| Graphic provided by: StockCharts.com. |
| |
| On May 25, prices tested key support from the previous February low (Figure 2). Buyers bought that support at 1040 and a bullish hammer candlestick produced a temporary low. The hammer candlestick has a long lower shadow that is much longer than the length of the real body. The real body is small and at the upper end of the trading range. The hammer was confirmed two sessions later with a bullish belt hold that took prices back to test the resistance at 1105. After two attempts to penetrate through the barrier, prices consolidated sideways before sinking back down to test support once again, bottoming out on June 8. In both cases, the rally fizzled when testing the 200-day moving average (MA). The next day, a bullish inverted hammer appeared. That pattern was confirmed the following day with a bullish belt hold candle as prices rallied back up to the intermediate trendline. |

|
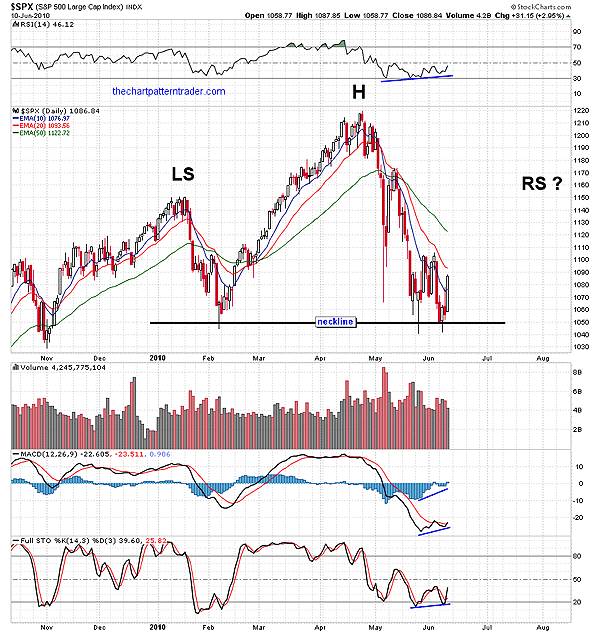
| FIGURE 2: $SPX, DAILY. The lows made in May and June successfully test the February low and complete the neckline for a large head & shoulders. Prices could now climb back up and form a right shoulder. |
| Graphic provided by: StockCharts.com. |
| |
| In hindsight, we can see that each bottom that formed was bolstered by bullish belt holds. A bullish belt hold candle confirmed both the hammer and the inverted hammer marking each distinct bottom. A bullish belt hold candle pattern is identified by a long white body with little or no lower shadow. The classic Adam & Eve double bottom is featured in Thomas Bulkowski's book The Encyclopedia Of Chart Patterns. An Adam & Eve double bottom combines one narrow and one wide bottom (Figure 1). The Adam bottom is narrow and is characterized by the long lower shadow of the hammer candlestick, which produced a one-day downward price spike. The Eve bottom, which is much wider, is distinguished by a more rounded bottom that produces price congestion. |
| The double-bottom pattern measured 65 points, taking the highest point of the pattern at 1105 and subtracting the lowest point of the pattern at 1040. By adding 65 points to the confirmation point at 1105, we get an objective target of 1170. Should prices be able to clear the declining trendline and then resurrect above the confirmation line, it will give birth to a new uptrend. I've drawn a trendline off the rally after the first bottom that may indicate new parameters for the upper price channel (solid green line) in Figure 1. If these previous price peaks are pointing to the next high, it would meet the target of 1170 for our double-bottom pattern. I've drawn a parallel line as the lower boundary to the speculative channel (dotted green line) in Figure 1. |
| The odds of the second bottom panning out have greatly increased, with a bullish divergence and cross on the moving average convergence/divergence (MACD) (12, 26, 9), and the stochastic (14, 3, 3). The relative strength index (RSI) (14) is also sporting a bullish divergence. In examining Figure 2, we can hypothesize that if the double-bottom scenario were to materialize, it could create a rather large bear flag pattern that would help accentuate a right shoulder in a massive head & shoulders pattern. But that would mean that any rally would ultimately have to fall short of the April peak. |
Ron Walker is an active trader and technical analyst. He operates an educational website dedicated to the study of Technical Analysis. The website offers free market analysis with daily video presentations and written commentaries. Ron is a video pioneer, being one of the first to utilize the internet producing Technical Analysis videos. His website is thechartpatterntrader.com
| Website: | thechartpatterntrader.com |
| E-mail address: | thechartpatterntrader@gmail.com |
Click here for more information about our publications!
Comments
Date: 06/15/10Rank: 4Comment:
Date: 06/18/10Rank: 5Comment:

Request Information From Our Sponsors
- StockCharts.com, Inc.
- Candle Patterns
- Candlestick Charting Explained
- Intermarket Technical Analysis
- John Murphy on Chart Analysis
- John Murphy's Chart Pattern Recognition
- John Murphy's Market Message
- MurphyExplainsMarketAnalysis-Intermarket Analysis
- MurphyExplainsMarketAnalysis-Visual Analysis
- StockCharts.com
- Technical Analysis of the Financial Markets
- The Visual Investor
- VectorVest, Inc.
- Executive Premier Workshop
- One-Day Options Course
- OptionsPro
- Retirement Income Workshop
- Sure-Fire Trading Systems (VectorVest, Inc.)
- Trading as a Business Workshop
- VectorVest 7 EOD
- VectorVest 7 RealTime/IntraDay
- VectorVest AutoTester
- VectorVest Educational Services
- VectorVest OnLine
- VectorVest Options Analyzer
- VectorVest ProGraphics v6.0
- VectorVest ProTrader 7
- VectorVest RealTime Derby Tool
- VectorVest Simulator
- VectorVest Variator
- VectorVest Watchdog
