HOT TOPICS LIST
- MACD
- Fibonacci
- RSI
- Gann
- ADXR
- Stochastics
- Volume
- Triangles
- Futures
- Cycles
- Volatility
- ZIGZAG
- MESA
- Retracement
- Aroon
INDICATORS LIST
LIST OF TOPICS
PRINT THIS ARTICLE
by Chaitali Mohile
American Medical System Holding has reached the historic high.
Position: N/A
Chaitali Mohile
Active trader in the Indian stock markets since 2003 and a full-time writer. Trading is largely based upon technical analysis.
PRINT THIS ARTICLE
TECHNICAL ANALYSIS
AMMD On Reverse Journey?
06/10/10 02:42:10 PMby Chaitali Mohile
American Medical System Holding has reached the historic high.
Position: N/A
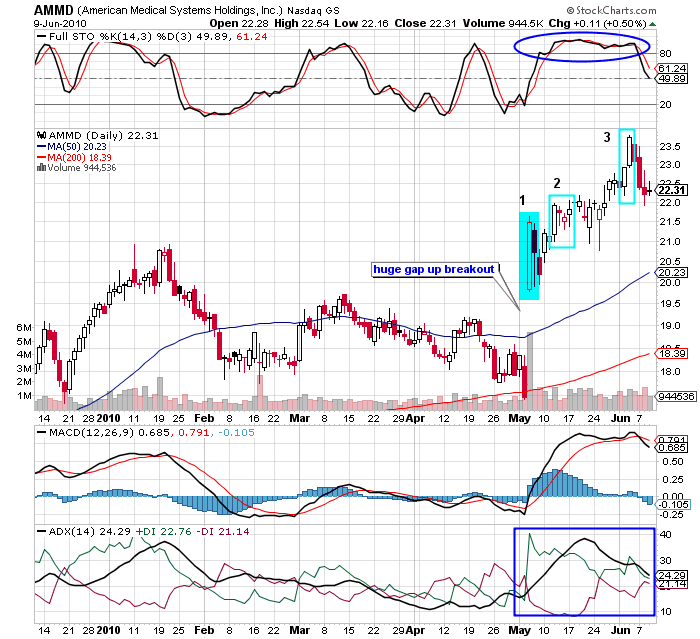
| A gap-up breakout of American Medical System Holding (AMMD) developed a fresh uptrend on the daily chart in Figure 1. Earlier, the weakness in the average directional movement index (ADX) (14) forced the rally to move at the support-resistance of the 50-day moving average (MA) and ultimately dragged AMMD to test the 200-day MA support. The stock bounced with this robust support and underwent the huge gap up breakout. The ADX (14), the moving average convergence/divergence (MACD) (12,26,9) and the full stochastic (14,3,3), surged into the bullish areas, thus extending a strong support to the gap-up breakout. A long white candle in Figure 1 (see box 1) signifies strength in the rally. The bearish sessions following the breakout day could not violate the high and low of the previous bullish candles. |
| Thereafter, AMMD continued its upward journey. The boxes marked 2 and 3 in Figure 1 shows the candles full of bullish force. The candles outside the boxes are bullish dojis with the long upper and lower shadows, pulling the stock higher. The doji candles indicated reluctance in the price rally as the indicators reached their extreme bullish region. If the two candles in box 3 were followed by the third bullish candle, we would have seen a healthy bullish reversal candlestick pattern -- three white soldiers -- on the chart. However, AMMD lacked the strength to rush upward. The overbought stochastic plunged to 50 levels and the overheated uptrend descended to the developing area below 25 levels. In addition, the MACD (12,26,9) turned negative in positive territory. As a result, the rally halted and reversed its path and headed in a downward direction. |

|
| FIGURE 1: AMMD, DAILY |
| Graphic provided by: StockCharts.com. |
| |
| AMMD has lost $1.50 from $23.50. Currently, the stock has reached the support level formed by the previous consolidation range. However, the increasing selling pressure and declining momentum is likely to pull down the price level to $21. Traders can consider positioning themselves at this level but should also evaluate the indicators. |

|
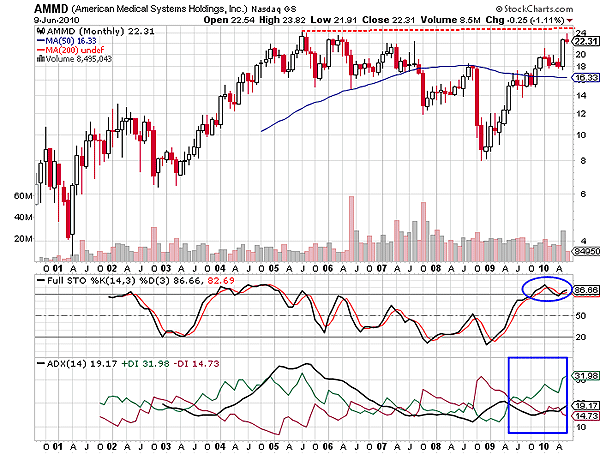
| FIGURE 2: AMMD, MONTHLY |
| Graphic provided by: StockCharts.com. |
| |
| Figure 2 shows the previous high resistances at $24 levels. In 2006, AMMD made a new high at $24, and thereafter, initiated a corrective rally, forming lower lows. Eventually, in 2009 AMMD surged above the 50-day MA resistance after establishing support at $8. During the rally, the buying pressure increased but the uptrend did not develop. The full stochastic (14,3,3) ascended from the oversold region, confirming the bullish momentum and generated fresh demand for the stock. Currently, we can see AMMD struggling near historical resistance. However, the overbought stochastic and the high buying pressure would sustain the bullishness in the rally and would help AMMD breach resistance. There would be a marginal correction near the current level as the previous highs are considered to be psychological resistance levels. |
| Thus, the recent bearish move is a temporary phase for AMMD. The long-term technical view of the stock still remains bullish. |
Active trader in the Indian stock markets since 2003 and a full-time writer. Trading is largely based upon technical analysis.
| Company: | Independent |
| Address: | C1/3 Parth Indraprasth Towers. Vastrapur |
| Ahmedabad, Guj 380015 | |
| E-mail address: | chaitalimohile@yahoo.co.in |
Traders' Resource Links | |
| Independent has not added any product or service information to TRADERS' RESOURCE. | |
Click here for more information about our publications!
PRINT THIS ARTICLE

Request Information From Our Sponsors
- StockCharts.com, Inc.
- Candle Patterns
- Candlestick Charting Explained
- Intermarket Technical Analysis
- John Murphy on Chart Analysis
- John Murphy's Chart Pattern Recognition
- John Murphy's Market Message
- MurphyExplainsMarketAnalysis-Intermarket Analysis
- MurphyExplainsMarketAnalysis-Visual Analysis
- StockCharts.com
- Technical Analysis of the Financial Markets
- The Visual Investor
- VectorVest, Inc.
- Executive Premier Workshop
- One-Day Options Course
- OptionsPro
- Retirement Income Workshop
- Sure-Fire Trading Systems (VectorVest, Inc.)
- Trading as a Business Workshop
- VectorVest 7 EOD
- VectorVest 7 RealTime/IntraDay
- VectorVest AutoTester
- VectorVest Educational Services
- VectorVest OnLine
- VectorVest Options Analyzer
- VectorVest ProGraphics v6.0
- VectorVest ProTrader 7
- VectorVest RealTime Derby Tool
- VectorVest Simulator
- VectorVest Variator
- VectorVest Watchdog
