HOT TOPICS LIST
- MACD
- Fibonacci
- RSI
- Gann
- ADXR
- Stochastics
- Volume
- Triangles
- Futures
- Cycles
- Volatility
- ZIGZAG
- MESA
- Retracement
- Aroon
INDICATORS LIST
LIST OF TOPICS
PRINT THIS ARTICLE
by Chaitali Mohile
Balchem Corp. is a steady stock with healthy gains for long-term as well as short-term traders.
Position: N/A
Chaitali Mohile
Active trader in the Indian stock markets since 2003 and a full-time writer. Trading is largely based upon technical analysis.
PRINT THIS ARTICLE
TRADING SYSTEMS
BCPC, A Reliable Stock
06/08/10 12:07:52 PMby Chaitali Mohile
Balchem Corp. is a steady stock with healthy gains for long-term as well as short-term traders.
Position: N/A
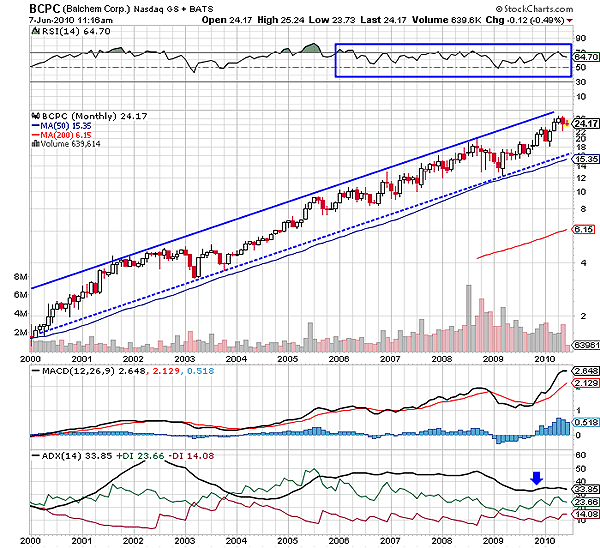
| Since 1999, Balchem Corp. (BCPC) has surged from $2 to $26, revealing handsome profits for long-term traders. The monthly time frame in Figure 1 shows an ascending channel formed during the entire period. We can see that price never breached the channel. After hitting trendlines on either side, the price has successfully bounced, reflecting the bullish strength in the rally. By now, many long-term traders and investors would have fared well with such great appreciation in the share value. The ascending channel gives safe entry and exit points for all types of trading activities. In a 10-year time span, traders might have triggered many long and short setups within the channel. |

|
| FIGURE 1: BCPC, MONTHLY. The upward rally of BCPC formed an ascending triangle. |
| Graphic provided by: StockCharts.com. |
| |
| The average directional movement index (ADX) (14) has been moving within the bullish space of an overheated and developed uptrend between the 50 and 30 levels. The relative strength index (RSI) (14) is bullish. Although the RSI (14) has formed a lower top, suggesting a negative divergence to the upward-moving price rally, the oscillator is moving in the bullish region of 50 and 70 levels (blue box in Figure 1). Therefore, the negative divergence would hardly dilute the bullish sentiment and strength in the rally. Currently, we can see BCPC struggling near the upper trendline of the channel. The uptrend is developed, so the single bearish factor (negative divergence) cannot spoil the bull's party. The stock would drop a few points from the highs, opening a short setup. Trading according to the monthly time frame is suitable for the long-term traders but not for the short- or medium-term traders. |
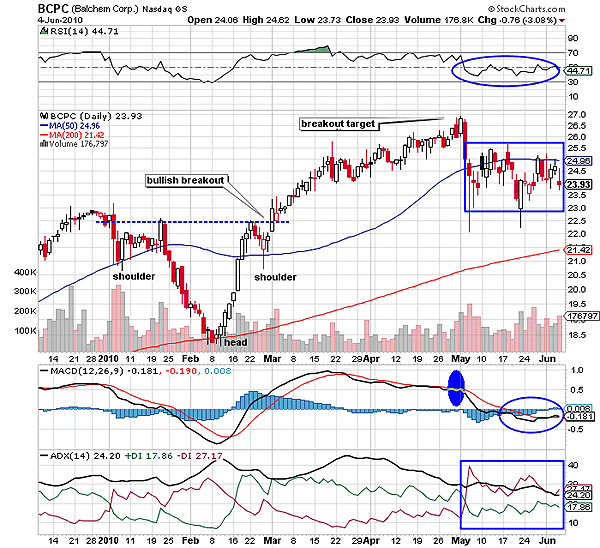
| For shorter term traders, the daily time frame chart (Figure 2) is more suitable. From the chart you can see that BCPC has retraced below the 50-day moving average (MA) support after meeting the target levels of an inverted head & shoulders formation. The intermediate bullish reversal pattern was formed in early 2010 with the neckline resistance at 22.5 levels. The breakout target was measured as 22.5 - 18.5 = 4 (the distance between the lowest point and the neckline); adding the distance (4) to the neckline line (22.5), we get the target of $26.5. According to Figure 2, BCPC corrected from $27 that is just few points above the estimated level. The stock has been under the pressure of the 50-day MA resistance for almost a month. Thereafter, BCPC moved in a range between $22.5 and $24. |

|
| FIGURE 2: BCPC, DAILY. An inverted head & shoulders pattern reversed the downtrend and initiated a fresh uptrend. By the time the target was achieved, the fresh bullish trend turned overheated, resulting in a bearish rally for BCPC. |
| Graphic provided by: StockCharts.com. |
| |
| The ADX (14) is indicating the developing downtrend; the RSI (14) has plunged below the 50 level. This would create volatility within the range. However, the breakout of the 50-day MA resistance would generate a fresh buying opportunity for the short-term traders. The moving average convergence/divergence (MACD) (12,26,9) is tangled with the trigger line, suggesting the current volatility in the price rally. Since the trend is bearish and the price is rallying below the 50-day MA resistance, traders can initiate a short trade with an intermediate target of $22.50. |
| To conclude, BCPC is the stock suitable for short-term as well as long-term traders. |
Active trader in the Indian stock markets since 2003 and a full-time writer. Trading is largely based upon technical analysis.
| Company: | Independent |
| Address: | C1/3 Parth Indraprasth Towers. Vastrapur |
| Ahmedabad, Guj 380015 | |
| E-mail address: | chaitalimohile@yahoo.co.in |
Traders' Resource Links | |
| Independent has not added any product or service information to TRADERS' RESOURCE. | |
Click here for more information about our publications!
PRINT THIS ARTICLE

Request Information From Our Sponsors
- StockCharts.com, Inc.
- Candle Patterns
- Candlestick Charting Explained
- Intermarket Technical Analysis
- John Murphy on Chart Analysis
- John Murphy's Chart Pattern Recognition
- John Murphy's Market Message
- MurphyExplainsMarketAnalysis-Intermarket Analysis
- MurphyExplainsMarketAnalysis-Visual Analysis
- StockCharts.com
- Technical Analysis of the Financial Markets
- The Visual Investor
- VectorVest, Inc.
- Executive Premier Workshop
- One-Day Options Course
- OptionsPro
- Retirement Income Workshop
- Sure-Fire Trading Systems (VectorVest, Inc.)
- Trading as a Business Workshop
- VectorVest 7 EOD
- VectorVest 7 RealTime/IntraDay
- VectorVest AutoTester
- VectorVest Educational Services
- VectorVest OnLine
- VectorVest Options Analyzer
- VectorVest ProGraphics v6.0
- VectorVest ProTrader 7
- VectorVest RealTime Derby Tool
- VectorVest Simulator
- VectorVest Variator
- VectorVest Watchdog
