HOT TOPICS LIST
- MACD
- Fibonacci
- RSI
- Gann
- ADXR
- Stochastics
- Volume
- Triangles
- Futures
- Cycles
- Volatility
- ZIGZAG
- MESA
- Retracement
- Aroon
INDICATORS LIST
LIST OF TOPICS
PRINT THIS ARTICLE
by Koos van der Merwe
With problems in Europe, the disappointing jobs report in the US, and the oil drama in the Gulf of Mexico, the question is, what's next?
Position: Accumulate
Koos van der Merwe
Has been a technical analyst since 1969, and has worked as a futures and options trader with First Financial Futures in Johannesburg, South Africa.
PRINT THIS ARTICLE
ELLIOTT WAVE
Where To Now?
06/07/10 12:39:15 PMby Koos van der Merwe
With problems in Europe, the disappointing jobs report in the US, and the oil drama in the Gulf of Mexico, the question is, what's next?
Position: Accumulate
| Once again I have to turn to my charts and believe in what they tell me. Once again I turn to The Elliott Wave Principle by AJ Frost and Robert Prechter for guidance, although lately I am beginning to disagree with Prechter's bearish viewpoint. However, that is what makes a market -- opposing views on what will happen next. Every economist has two hands, after all, and this is also true for technical analysts. |

|
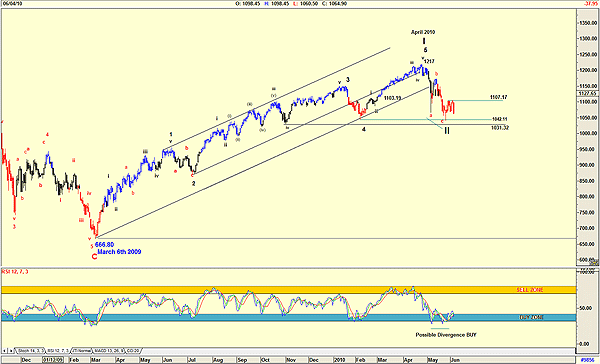
| FIGURE 1: SPX |
| Graphic provided by: AdvancedGET. |
| |
| Figure 1 is once again a daily chart of the Standard & Poor's 500, showing my wave count suggesting that April 2010 is a major Wave I and that market movement since then is a major Wave II. Observe that the index is in the range of the fourth wave of a lesser degree, but this rule does not apply to a major Wave II, which can be as much as a 70% retracement of a major Wave I. In other words, the index can test the 831 level (70% retracement of 1217 - 666 = 551 * 70% = 385. 1217 - 385 = 831), but this is not a fixed perecentage, as a Wave II can bottom wherever it wants to. The relative strength index (RSI) is, however, suggesting strength with a divergent buy signal, and bolster bullish sentiment. The index will have to break above the 1107.17 level, a point that has become a strong resistance level. Looking back in the chart, you can see that every time the RSI has fallen to the present level, the correction has reversed. There is no reason to believe that this could not happen again. At the moment, I feel as isolated as a bull in a bear trend, but I am convinced that I am correct in my prediction. The best time to buy stocks is when everyone is bearish, and at the moment, almost everyone is. But most analysts, like economists, do have two hands, so they can only be 50% wrong. The secret is to change your opinion fast. |
Has been a technical analyst since 1969, and has worked as a futures and options trader with First Financial Futures in Johannesburg, South Africa.
| Address: | 3256 West 24th Ave |
| Vancouver, BC | |
| Phone # for sales: | 6042634214 |
| E-mail address: | petroosp@gmail.com |
Click here for more information about our publications!
Comments
Date: 06/08/10Rank: 5Comment: Koos,
The probability of a double dip recession have increased dramatically. That said, the 831 figure looks possible.
Hope all is well. Dick Slayton
Date: 06/08/10Rank: 3Comment:
Date: 06/12/10Rank: 3Comment:

Request Information From Our Sponsors
- VectorVest, Inc.
- Executive Premier Workshop
- One-Day Options Course
- OptionsPro
- Retirement Income Workshop
- Sure-Fire Trading Systems (VectorVest, Inc.)
- Trading as a Business Workshop
- VectorVest 7 EOD
- VectorVest 7 RealTime/IntraDay
- VectorVest AutoTester
- VectorVest Educational Services
- VectorVest OnLine
- VectorVest Options Analyzer
- VectorVest ProGraphics v6.0
- VectorVest ProTrader 7
- VectorVest RealTime Derby Tool
- VectorVest Simulator
- VectorVest Variator
- VectorVest Watchdog
- StockCharts.com, Inc.
- Candle Patterns
- Candlestick Charting Explained
- Intermarket Technical Analysis
- John Murphy on Chart Analysis
- John Murphy's Chart Pattern Recognition
- John Murphy's Market Message
- MurphyExplainsMarketAnalysis-Intermarket Analysis
- MurphyExplainsMarketAnalysis-Visual Analysis
- StockCharts.com
- Technical Analysis of the Financial Markets
- The Visual Investor
