HOT TOPICS LIST
- MACD
- Fibonacci
- RSI
- Gann
- ADXR
- Stochastics
- Volume
- Triangles
- Futures
- Cycles
- Volatility
- ZIGZAG
- MESA
- Retracement
- Aroon
INDICATORS LIST
LIST OF TOPICS
PRINT THIS ARTICLE
by Ron Walker
The S&P 500 looks poised to rally for the short term, but such a rally may prove to be its demise over the long term, should a large head & shoulders pattern form on the daily chart.
Position: N/A
Ron Walker
Ron Walker is an active trader and technical analyst. He operates an educational website dedicated to the study of Technical Analysis. The website offers free market analysis with daily video presentations and written commentaries. Ron is a video pioneer, being one of the first to utilize the internet producing Technical Analysis videos. His website is thechartpatterntrader.com
PRINT THIS ARTICLE
TECHNICAL ANALYSIS
The Short- And Long-Term Trading Itinerary For The S&P 500
06/04/10 08:51:47 AMby Ron Walker
The S&P 500 looks poised to rally for the short term, but such a rally may prove to be its demise over the long term, should a large head & shoulders pattern form on the daily chart.
Position: N/A
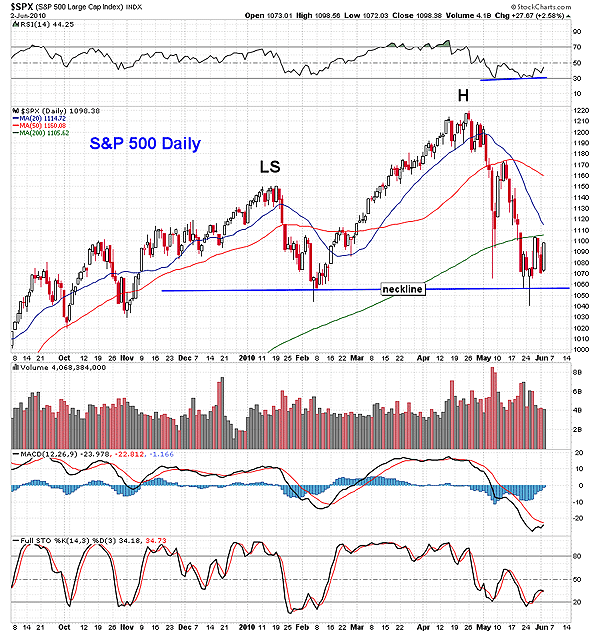
| After witnessing a mammoth-sized selloff in the stock market, the dust settled on the Standard & Poor's 500 near the February 2010 intraday low of 1044 on the daily chart (Figure 1). Traders began to reload at key support, snapping up shares of battered-down stocks. As speculators placed their bets, prices began to drift sideways, forming a base. |

|
| FIGURE 1: $SPX, DAILY. The S&P 500 found support when it tagged the February low. This completed a head in a potentially large head & shoulders top. |
| Graphic provided by: StockCharts.com. |
| |
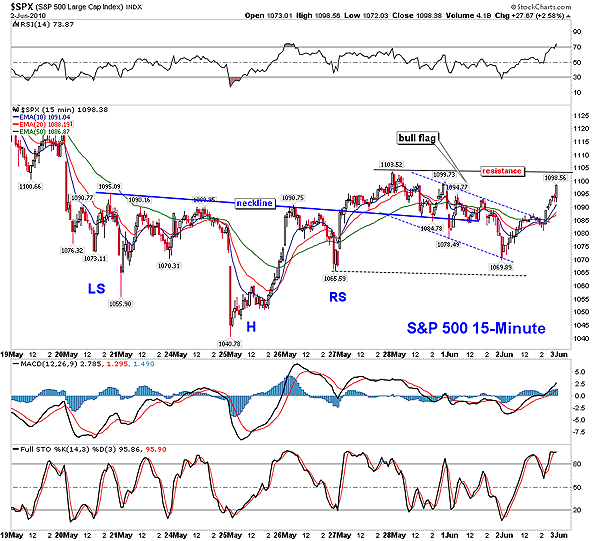
| The price gyrations that moved back and forth at support on the daily chart carved out an inverse head & shoulders reversal pattern clearly visible on the 15-minute chart of the S&P 500 (Figure 2). Shortly after the completion of the right shoulder, prices catapulted through the neckline of the pattern in late May, spearheading a new uptrend in that time frame with a higher high and higher low. After surging to a new high, prices experienced a deep correction, falling back below the neckline of the pattern in an extended throwback. During this corrective phase, a small bull flag formed as prices came in close proximity to the lows made during the right shoulder of the inverse head & shoulders pattern. Buyers came in and bought the dip, producing another higher low. Prices rallied, breaking out of the bull flag, and escalated higher toward resistance. If prices can leap above the peak that was made on the inverse head & shoulders pattern, it could be en route to chiseling out a massive right shoulder on the S&P 500 daily chart. |

|
| FIGURE 2: $SPX, 15-MINUTE. After breaking out of a inverse head & shoulders pattern on the 15-minute chart, the S&P 500 formed a bull flag that produced another higher low. For the advance to resume, prices must climb above the peak that occurred after the inverse head & shoulders broke out. |
| Graphic provided by: StockCharts.com. |
| |
| Glancing back at Figure 1, you will note that the S&P 500 showcases the S&P 500 daily chart with a completed left shoulder & head. If the current rally in the 15-minute time frame continues to build momentum, prices could climb back to the 50-day moving average (MA), which is hovering near the January high of 1150. Should the advance stall, the S&P 500 could reverse hard and complete the pattern. |

|
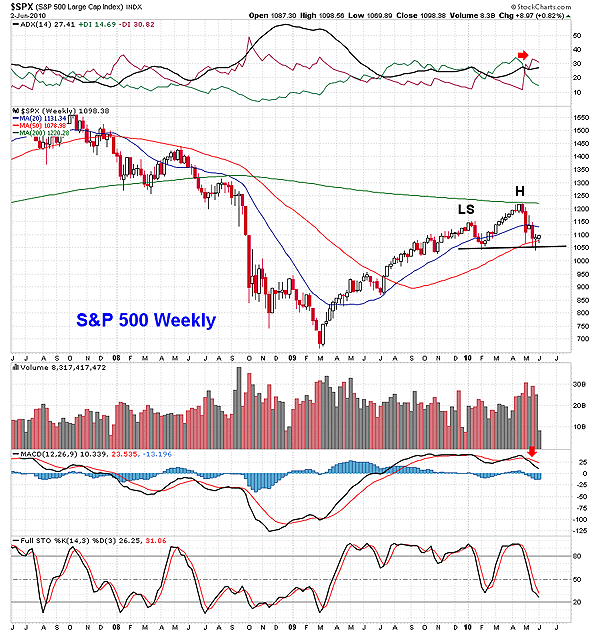
| FIGURE 3: $SPX, WEEKLY. The weekly chart of the S&P 500 shows that trend-based indicators such as the ADX (14) and the MACD (12, 26, 9) remain bearish. Further, the S&P 500 reversed off its 200-week MA. |
| Graphic provided by: TeleChart2007. |
| |
| In Figure 3, we see a snapshot of the S&P 500 daily chart hovering below the 200-day MA. The extended pullback that formed the bull flag on the 15-minute chart allowed a higher low to develop in the daily time frame. After forming a hammer candlestick at the May low, prices rallied up to the 200-day MA. A reaction occurred off the 200-day MA, driving prices back and producing a successful higher low. Now prices need to exceed the 200-day MA in order to make a higher high. If the S&P 500 can clear the 200- and 20-day MAs, it could make a mad dash for the 50-day MA, which is hovering near the January high. It would be difficult for the S&P 500 to move above the January overhead resistance with the 50-day MA, sloping lower and barreling down near that resistance point. The S&P 500 weekly chart in Figure 3 hints that the head & shoulders pattern may fully evolve. The moving average convergence/divergence (MACD) (12, 26, 9) recently got a bearish divergence with the S&P 500 that resulted in a bearish crossover in early May. Moreover, the positive and negative directional indicators (+/-DI) recently got a bearish crossover, signaling a long-term sell signal. The directional DI lines appear on the average directional index (ADX) (14) that recently turned up, strengthening -DI. Therefore, if prices rally back up, it may only be to form a contratrend based on the bearish indicators mentioned. |
| If prices peak near the 50-day MA, creating the top of the right shoulder, it will present another chance to short the market. |
Ron Walker is an active trader and technical analyst. He operates an educational website dedicated to the study of Technical Analysis. The website offers free market analysis with daily video presentations and written commentaries. Ron is a video pioneer, being one of the first to utilize the internet producing Technical Analysis videos. His website is thechartpatterntrader.com
| Website: | thechartpatterntrader.com |
| E-mail address: | thechartpatterntrader@gmail.com |
Click here for more information about our publications!
Comments
Date: 06/07/10Rank: 4Comment:

Request Information From Our Sponsors
- VectorVest, Inc.
- Executive Premier Workshop
- One-Day Options Course
- OptionsPro
- Retirement Income Workshop
- Sure-Fire Trading Systems (VectorVest, Inc.)
- Trading as a Business Workshop
- VectorVest 7 EOD
- VectorVest 7 RealTime/IntraDay
- VectorVest AutoTester
- VectorVest Educational Services
- VectorVest OnLine
- VectorVest Options Analyzer
- VectorVest ProGraphics v6.0
- VectorVest ProTrader 7
- VectorVest RealTime Derby Tool
- VectorVest Simulator
- VectorVest Variator
- VectorVest Watchdog
- StockCharts.com, Inc.
- Candle Patterns
- Candlestick Charting Explained
- Intermarket Technical Analysis
- John Murphy on Chart Analysis
- John Murphy's Chart Pattern Recognition
- John Murphy's Market Message
- MurphyExplainsMarketAnalysis-Intermarket Analysis
- MurphyExplainsMarketAnalysis-Visual Analysis
- StockCharts.com
- Technical Analysis of the Financial Markets
- The Visual Investor
