HOT TOPICS LIST
- MACD
- Fibonacci
- RSI
- Gann
- ADXR
- Stochastics
- Volume
- Triangles
- Futures
- Cycles
- Volatility
- ZIGZAG
- MESA
- Retracement
- Aroon
INDICATORS LIST
LIST OF TOPICS
PRINT THIS ARTICLE
by Koos van der Merwe
Everyone is aware of the oil crisis in the Gulf of Mexico. Will BP come out of it a company worth owning?
Position: Accumulate
Koos van der Merwe
Has been a technical analyst since 1969, and has worked as a futures and options trader with First Financial Futures in Johannesburg, South Africa.
PRINT THIS ARTICLE
ELLIOTT WAVE
Is British Petroleum A Buy?
06/04/10 08:39:35 AMby Koos van der Merwe
Everyone is aware of the oil crisis in the Gulf of Mexico. Will BP come out of it a company worth owning?
Position: Accumulate
| BP is a British global energy company that is the third-largest energy company and the fourth-largest company in the world. As a multinational oil company, BP is the UK's largest corporation. Talk of the sale of assets in Alaska and around the world to raise cash to pay for the oil cleanup is rife. Only time will tell whether these rumors are reality or fairy tales. Charts, however, suggest a different story. |

|
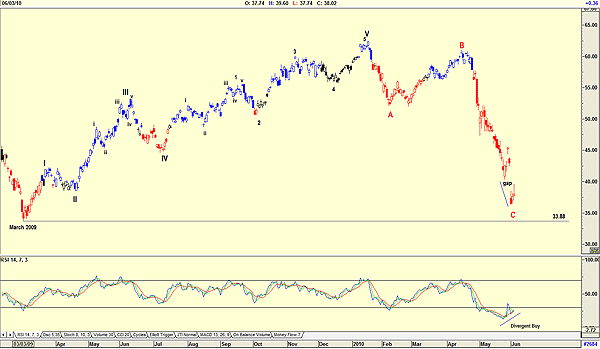
| FIGURE 1: BP, DAILY. This chart shows an Elliott wave pattern. |
| Graphic provided by: AdvancedGET. |
| |
| Figure 1 is a daily chart of BP and shows the following: 1. An Elliott wave count that suggests that a C-wave has been completed. This should be followed by a Wave I up, which could take some time to assert itself the way the start of new bull trends usually do. In addition, keep in mind that when Wave I starts, it rises in five waves, with wave 2 of Wave I as much as a 70% correction, suggesting a continuation of the downtrend. Sound complicated? 2. The relative strength index (RSI) is suggesting a divergent buy. 3. The fall in the price came with a gap, and prices rise to fill the gap. Should the price at any stage rise with a gap forming, the pattern will then be an island reversal, which is a very bullish pattern. 4. Do note that the price has not yet fallen to the low of March 2009 at $33.88. |

|
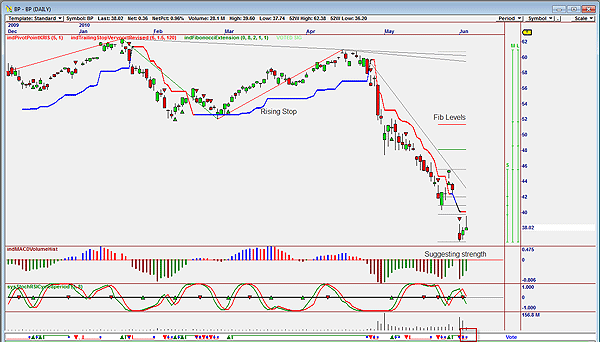
| FIGURE 2: BP, DAILY. This chart suggests a sell signal stop. |
| Graphic provided by: OmniTrader. |
| |
| Figure 2 shows the following: a. The vote line has stopped out the sell signal, as shown by the red box. b. The moving average convergence/divergence (MACD) volume indicator is suggesting strength. c. The stochastic RSI cycle 8 period is still showing weakness. d. Volume has fallen as the price has risen, suggesting weakness. With all the troubles ahead for British Petroleum, including criminal investigations as well as the cost of a massive oil cleanup that definitely will take years to complete, by looking at the charts, you could start adding the share to your long-term portfolio, as long as you know that you will not wake up in the middle of the night worrying. Will the company go bankrupt? It is possible, but unlikely — then again, who would ever have thought that Lehman Brothers would cease to exist? |
Has been a technical analyst since 1969, and has worked as a futures and options trader with First Financial Futures in Johannesburg, South Africa.
| Address: | 3256 West 24th Ave |
| Vancouver, BC | |
| Phone # for sales: | 6042634214 |
| E-mail address: | petroosp@gmail.com |
Click here for more information about our publications!
Comments
Date: 06/07/10Rank: 4Comment:
Date: 06/08/10Rank: 4Comment: Koos:
Will the dividend hold. If so I agree with your accumulate recommendation. If not then I d wait. Dick Slayton

Request Information From Our Sponsors
- StockCharts.com, Inc.
- Candle Patterns
- Candlestick Charting Explained
- Intermarket Technical Analysis
- John Murphy on Chart Analysis
- John Murphy's Chart Pattern Recognition
- John Murphy's Market Message
- MurphyExplainsMarketAnalysis-Intermarket Analysis
- MurphyExplainsMarketAnalysis-Visual Analysis
- StockCharts.com
- Technical Analysis of the Financial Markets
- The Visual Investor
- VectorVest, Inc.
- Executive Premier Workshop
- One-Day Options Course
- OptionsPro
- Retirement Income Workshop
- Sure-Fire Trading Systems (VectorVest, Inc.)
- Trading as a Business Workshop
- VectorVest 7 EOD
- VectorVest 7 RealTime/IntraDay
- VectorVest AutoTester
- VectorVest Educational Services
- VectorVest OnLine
- VectorVest Options Analyzer
- VectorVest ProGraphics v6.0
- VectorVest ProTrader 7
- VectorVest RealTime Derby Tool
- VectorVest Simulator
- VectorVest Variator
- VectorVest Watchdog
