HOT TOPICS LIST
- MACD
- Fibonacci
- RSI
- Gann
- ADXR
- Stochastics
- Volume
- Triangles
- Futures
- Cycles
- Volatility
- ZIGZAG
- MESA
- Retracement
- Aroon
INDICATORS LIST
LIST OF TOPICS
PRINT THIS ARTICLE
by Austin Passamonte
As the year comes to a close, the major indices approach resistance levels and the technicals show signs of weakness.
Position: N/A
Austin Passamonte
Austin is a private trader who trades emini stock index futures intraday. He currently trades various futures markets from home in addition to managing a trader's educational forum
PRINT THIS ARTICLE
TECHNICAL ANALYSIS
The Big Indices Reach Resistance
12/28/01 02:38:32 PMby Austin Passamonte
As the year comes to a close, the major indices approach resistance levels and the technicals show signs of weakness.
Position: N/A
| Realizations are that the major indexes will close the year 2001 in the red but a moral victory would be their ascent to new recent highs. That seems to be the expectation with a mere handful of sessions left before champagne corks begin to pop in domino effect around the globe. |
| What do the chart picture's show? I wonder... |

|
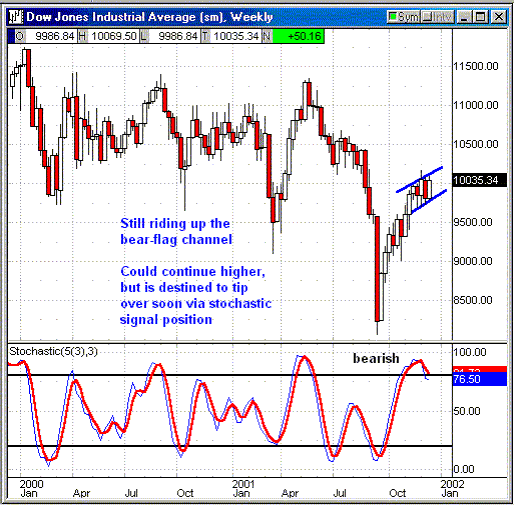
| Figure 1: Weekly Chart: DOW |
| Graphic provided by: Quote.com. |
| Graphic provided by: QCharts. |
| |
| The Dow finished another positive week but did nothing to break this growing bear flag. Think there are any buyers near support and sellers near resistance? You betcha! Think that will change soon? I doubt it. Price action threatens to break higher and very well may, but no charts we're looking at right now have any oscillators that suggest playing the upside is a high-odds bet from here. It appears that indexes may rise in agony during the light volume sessions ahead, but a full-blown upside explosion would surprise their charts from here. |
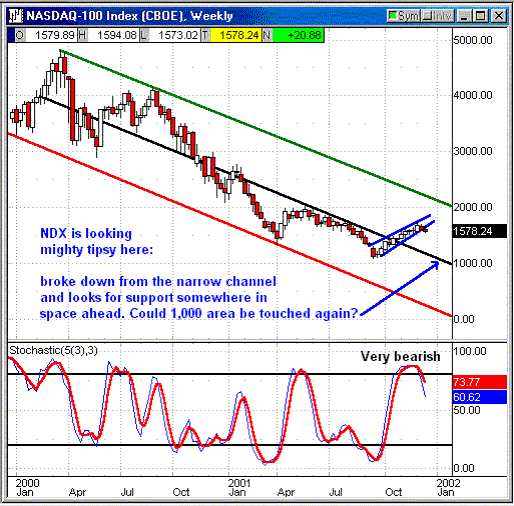
 Figure 2: Weekly Chart: NDX A revitalized NDX may take its new additions and pop right back into the ascending channel from 9/24 but that's not how we'd play it. Price action is beneath recent resistance now and those stochastic values are clearly bearish, two strikes against long buy & hold plays. Does that mandate a trip straight down to 1,000? Not hardly, but 2,000 level is equally challenging from where price action rests tonight. |
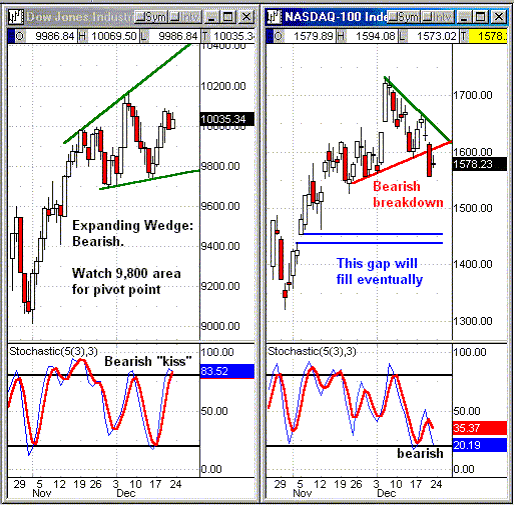
 Figure 3: Daily Charts: Dow & NDX From our daily chart view the Dow (left) looks stronger but that's a relative term. I'd say another pass up into the expanding wedge depicted is possible. One could easily move that upper line to recent candle highs and form a nice little neutral wedge as well (not pictured). See that with your eyes? Of course you do! There are four clear touches on that wedge with last Friday's high topped off at resistance on the upper line if we draw it in. Stochastic values are in overbought extreme again and posting a bearish touch or "kiss". If those lines reverse and turn down from the 80% overbought line, it would align weekly and daily charts into an overbought extreme right here. This is a setup to possibly get on the right side of building pressure due to be released downward soon. Heaven knows where the big indexes will close at the end of 2002 or what route they'll take to get there. A higher close than current levels is certainly possible through the course of this final week, but we'd feel better about gaming it if charts didn't look so weak. |
Austin is a private trader who trades emini stock index futures intraday. He currently trades various futures markets from home in addition to managing a trader's educational forum
| Title: | Individual Trader |
| Company: | CoiledMarkets.com |
| Address: | PO Box 633 |
| Naples, NY 14512 | |
| Website: | coiledmarkets.com/blog |
| E-mail address: | austinp44@yahoo.com |
Traders' Resource Links | |
| CoiledMarkets.com has not added any product or service information to TRADERS' RESOURCE. | |
Click here for more information about our publications!
Comments
Date: 12/29/01Rank: 4Comment:
Date: 12/31/01Rank: 5Comment: If I look at the DOw I see a H S formation with the 2ns shoulder forming now, this would agree with the bearish kiss . (Which I do not know what it is in detail).Would you agree? I would like your comments.
Thanks, Happy New Year
ZZ
zboroz@email.msn.com
Date: 01/01/02Rank: 5Comment:
Date: 01/03/02Rank: 3Comment:
Date: 01/03/02Rank: 4Comment:
Date: 01/03/02Rank: 4Comment:

Request Information From Our Sponsors
- VectorVest, Inc.
- Executive Premier Workshop
- One-Day Options Course
- OptionsPro
- Retirement Income Workshop
- Sure-Fire Trading Systems (VectorVest, Inc.)
- Trading as a Business Workshop
- VectorVest 7 EOD
- VectorVest 7 RealTime/IntraDay
- VectorVest AutoTester
- VectorVest Educational Services
- VectorVest OnLine
- VectorVest Options Analyzer
- VectorVest ProGraphics v6.0
- VectorVest ProTrader 7
- VectorVest RealTime Derby Tool
- VectorVest Simulator
- VectorVest Variator
- VectorVest Watchdog
- StockCharts.com, Inc.
- Candle Patterns
- Candlestick Charting Explained
- Intermarket Technical Analysis
- John Murphy on Chart Analysis
- John Murphy's Chart Pattern Recognition
- John Murphy's Market Message
- MurphyExplainsMarketAnalysis-Intermarket Analysis
- MurphyExplainsMarketAnalysis-Visual Analysis
- StockCharts.com
- Technical Analysis of the Financial Markets
- The Visual Investor
