HOT TOPICS LIST
- MACD
- Fibonacci
- RSI
- Gann
- ADXR
- Stochastics
- Volume
- Triangles
- Futures
- Cycles
- Volatility
- ZIGZAG
- MESA
- Retracement
- Aroon
INDICATORS LIST
LIST OF TOPICS
PRINT THIS ARTICLE
by Donald W. Pendergast, Jr.
The ARMS index — also known as TRIN, or the trader's index — is a valuable tool for those attempting to measure the likelihood of broad market reversal and consolidation phases. Right now, the NYSE TRIN may be suggesting a temporary pause in the current selling spree in the S&P 500.
Position: N/A
Donald W. Pendergast, Jr.
Donald W. Pendergast is a financial markets consultant who offers specialized services to stock brokers and high net worth individuals who seek a better bottom line for their portfolios.
PRINT THIS ARTICLE
ARMS INDEX
Do High TRIN Values Mean A Temporary Pause In Selloff?
06/02/10 09:15:57 AMby Donald W. Pendergast, Jr.
The ARMS index — also known as TRIN, or the trader's index — is a valuable tool for those attempting to measure the likelihood of broad market reversal and consolidation phases. Right now, the NYSE TRIN may be suggesting a temporary pause in the current selling spree in the S&P 500.
Position: N/A
| The Arms index, also referred to as the trader's index (TRIN), does an excellent job of assisting traders in determining the health of the broad US markets, particularly the NYSE Composite (NYA) and the Standard & Poor's 500 (SPX) indexes. The index is calculated like this: Advancing issues/declining issues ---------------------------------- Advancing volume/declining volume Typically, a value less than 1 is interpreted as potentially bullish, while values greater than 1 may be viewed as potentially bearish. However, most traders make the best use of the indicator when it gets to extreme levels in the heat of the intraday market battles; for example, if you see that the emini S&P contract has just broken down through a key support level (floor trader pivots, 60-minute chart trendline, 50- or 200-period moving averages, and so on) and you see the TRIN spike from 1.15 to 1.50 or higher, the probabilities favor the continuation of more downside movement toward at least the next significant intraday support level. This article, however, will focus on an unusual way to interpret the daily closing values of the TRIN. So let's take a look at a 30-minute chart of the TRIN to see what may be afoot in the broad market in the next session or two. See Figure 1. |

|
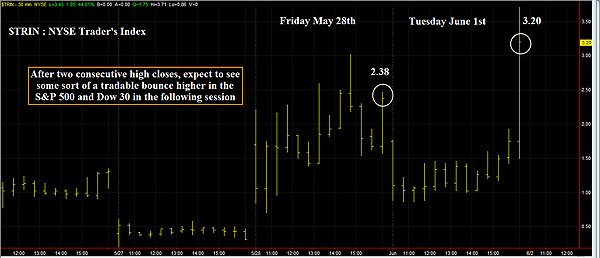
| FIGURE 1: TRIN. It's not a locked-in profit opportunity, but whenever you see the NYSE TRIN make two consecutive closes near 2.50, 3.00, 3.50, or higher, you may very well see a tradable bullish bounce from intraday support during the next trading session. |
| Graphic provided by: TradeStation. |
| |
| On this 30-minute chart, note the extreme end-of-day readings on Friday, May 28, 2010, and Tuesday, June 1, 2010; Friday's TRIN came in at 2.38, while Tuesday's closed even higher at 3.20. Many times, when you see two back-to-back daily closes above 2.00 or 3.00, you may expect to see some sort of a tradable bullish bounce in the very next session. This opportunity for a tradable bounce higher becomes most likely if the market in question declines to a solid daily or intraday support level. Our next chart will attempt to identify where those levels exist in the S&P 500 for Wednesday's trading session. |

|
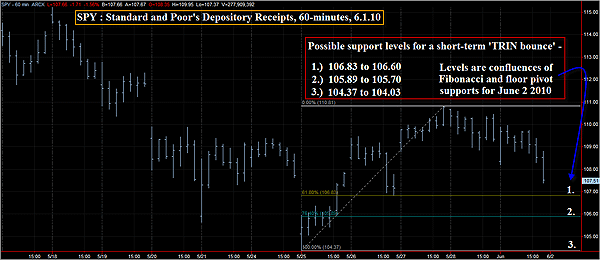
| FIGURE 2: SPY, HOURLY. Of the three labeled support levels (constructed from Fibonacci and floor trader pivot support levels for the following trading session), nos. 1 and 3 are the strongest, as they include prior swing low supports. Nevertheless, there is no reason why support level 2 cannot also act as reasonably solid support. |
| Graphic provided by: TradeStation. |
| |
| Figure 2 is the 60-minute chart for SPY, the index exchange traded fund (ETF) that tracks the movement of the S&P 500. While the price action on the chart is definitely of the bearish persuasion, as we recall the current configuration of the NYSE TRIN, we already know that there may be a good opportunity to grab hold of a tradable bullish bounce higher from significant intraday support levels. Stretched across the last few days of trading is a simple Fibonacci grid, one that has identified strong support levels at the 62%, 79%, and 100% retracement levels. In addition, I've gone ahead and already calculated Wednesday's intraday floor pivot support levels (S1, S2, and S3) and when combined together, the Fibs and pivots produce almost identical support confluence levels (see the figures in the red box). I've also labeled these specific support zones as 1, 2, and 3 on the chart. Getting more specific, support levels 1 and 3 are likely going to be the strongest, as they also include previous swing lows on the chart. Support level 2 is also formidable and should not be discounted. So now that you know where to expect some sort of support for Wednesday's trading session, here are a few tips as to how best to play this potential short-term TRIN setup. |
| First off, look to see if there is an opening gap lower toward any of these three support levels; note the volume, intraday TRIN readings, and the range of the intraday bars (using a five- to 10-minute time frame may be best to capture a possible bullish spike higher from support, as the long-term trend in this market is extremely bearish for the next few months). If, after evaluating the price action during the first hour, you determine that the fear is temporarily washed out of the market, prepare to go long after one of these support levels holds (a five-minute double-bottom pattern is preferred before actually entering long). A simple entry trigger is a 10-period stochRSI; you might go long if the indicator crosses above its lower signal line and then trail any resulting move with a three-bar trailing stop of the five-minute lows. You may have an even better intraday trigger, so if that's the case, go for it. Just remember that a trade like this is actually a countertrend trade, so be prepared to close out and/or reverse your position at the first hint of trouble. This big bad bear is very cranky and very hungry (some technicians would argue that Mr. Grizzly Bear hasn't even begun the main course yet, implying much more severe market losses in the months and years to come) and you certainly don't want to overstay your welcome on his native turf. |
Donald W. Pendergast is a financial markets consultant who offers specialized services to stock brokers and high net worth individuals who seek a better bottom line for their portfolios.
| Title: | Writer, market consultant |
| Company: | Linear Trading Systems LLC |
| Jacksonville, FL 32217 | |
| Phone # for sales: | 904-239-9564 |
| E-mail address: | lineartradingsys@gmail.com |
Traders' Resource Links | |
| Linear Trading Systems LLC has not added any product or service information to TRADERS' RESOURCE. | |
Click here for more information about our publications!
Comments

Request Information From Our Sponsors
- StockCharts.com, Inc.
- Candle Patterns
- Candlestick Charting Explained
- Intermarket Technical Analysis
- John Murphy on Chart Analysis
- John Murphy's Chart Pattern Recognition
- John Murphy's Market Message
- MurphyExplainsMarketAnalysis-Intermarket Analysis
- MurphyExplainsMarketAnalysis-Visual Analysis
- StockCharts.com
- Technical Analysis of the Financial Markets
- The Visual Investor
- VectorVest, Inc.
- Executive Premier Workshop
- One-Day Options Course
- OptionsPro
- Retirement Income Workshop
- Sure-Fire Trading Systems (VectorVest, Inc.)
- Trading as a Business Workshop
- VectorVest 7 EOD
- VectorVest 7 RealTime/IntraDay
- VectorVest AutoTester
- VectorVest Educational Services
- VectorVest OnLine
- VectorVest Options Analyzer
- VectorVest ProGraphics v6.0
- VectorVest ProTrader 7
- VectorVest RealTime Derby Tool
- VectorVest Simulator
- VectorVest Variator
- VectorVest Watchdog
