HOT TOPICS LIST
- MACD
- Fibonacci
- RSI
- Gann
- ADXR
- Stochastics
- Volume
- Triangles
- Futures
- Cycles
- Volatility
- ZIGZAG
- MESA
- Retracement
- Aroon
INDICATORS LIST
LIST OF TOPICS
PRINT THIS ARTICLE
by Donald W. Pendergast, Jr.
Tuesday's intraday reversal off of major Fibonacci support looks like a hopeful development, but just how far might the Russell 2000 index travel before stalling again?
Position: N/A
Donald W. Pendergast, Jr.
Donald W. Pendergast is a financial markets consultant who offers specialized services to stock brokers and high net worth individuals who seek a better bottom line for their portfolios.
PRINT THIS ARTICLE
SWING CHART
Russell 2000 At 79% Fibonacci Support - Will It Hold?
05/26/10 08:33:04 AMby Donald W. Pendergast, Jr.
Tuesday's intraday reversal off of major Fibonacci support looks like a hopeful development, but just how far might the Russell 2000 index travel before stalling again?
Position: N/A
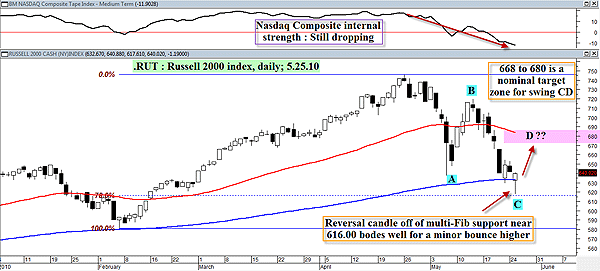
| If you've been reading Traders.com Advantage for the last week or so, then you're already aware that there was a major Fibonacci support confluence level near the 615.00 area for the Russell 2000 index (R2K) and that a reasonably well-proportioned bullish Gartley pattern was also anticipated to complete near that same price level. Well, the support held (for one day, anyway) and the Gartley pattern looks like a go. So now what? What is the likely pathway for the R2K, and when will this small-cap index meet strong resistance again? A glance at the R2K daily chart provides us with several technical clues (Figure 1). |

|
| FIGURE 1: RUT, DAILY. If the reversal from major Fibonacci support gathers strength, the zone from 668 to 680 is a logical target area. However, the very weak internal strength of the market may mitigate the R2K actually rising that high anytime soon. |
| Graphic provided by: MetaStock. |
| |
| When a bullish Gartley pattern completes, the nominal target price for the new bullish swing is normally projected to be about 62% of the length of the last downswing (swing BC), meaning that 680.00 is the nominal target for this new upswing (in a perfect world, at least). In addition, if we use some basic swing projection length mathematics, the formula ((B - A) * .618)+ C) = ((719.70 - 637.69) *.618) + 617.61) = (82.01 * .618)+ 617.61 = 50.68 + 617.61 = 668.292 also gives a target close to that of the bullish Gartley pattern. This means that we have the means to calculate a ballpark figure to work with as far as projecting how far this move may go before another reversal or pause asserts itself. It does not mean that the R2K will make it that high on this new reversal, if it is a reversal at all. For all we know, the Gartley pattern may fail and the R2K could drop down below 600 this week, challenging the February lows near 575.00. Bottom line? If you see the R2K approach 670 or 680, be prepared to exit the market at a moment's notice and/or go short on suitable reversal patterns. You'll also note that the downsloping 50-day exponential moving average (EMA) (red line) is also near 680, adding yet another logical place for any upswing to face heavy resistance. |
| While the bullish Gartley pattern and the strong intraday reversal off of key Fibonacci support bodes well for some further upside, note the bearish NASDAQ Composite internal strength indicator (top of the chart); there is no sign of positive (bullish) divergence yet, and that might be considered the giant-sized red flashing warning light on this chart. So if you are going to venture out to the long side of the R2K anytime soon, keep an eye on things like the NASDAQ Composite advance/decline line, new highs/new lows ratio, upside/downside volume ratio, and so forth. It's a great way to monitor the health of the R2K and any new small-cap stock positions you may add on the long side. Just be sure to have an exact entry/exit strategy so that you don't get waylaid by any unexpected gyrations in this extremely volatile market. |
Donald W. Pendergast is a financial markets consultant who offers specialized services to stock brokers and high net worth individuals who seek a better bottom line for their portfolios.
| Title: | Writer, market consultant |
| Company: | Linear Trading Systems LLC |
| Jacksonville, FL 32217 | |
| Phone # for sales: | 904-239-9564 |
| E-mail address: | lineartradingsys@gmail.com |
Traders' Resource Links | |
| Linear Trading Systems LLC has not added any product or service information to TRADERS' RESOURCE. | |
Click here for more information about our publications!
Comments

Request Information From Our Sponsors
- StockCharts.com, Inc.
- Candle Patterns
- Candlestick Charting Explained
- Intermarket Technical Analysis
- John Murphy on Chart Analysis
- John Murphy's Chart Pattern Recognition
- John Murphy's Market Message
- MurphyExplainsMarketAnalysis-Intermarket Analysis
- MurphyExplainsMarketAnalysis-Visual Analysis
- StockCharts.com
- Technical Analysis of the Financial Markets
- The Visual Investor
- VectorVest, Inc.
- Executive Premier Workshop
- One-Day Options Course
- OptionsPro
- Retirement Income Workshop
- Sure-Fire Trading Systems (VectorVest, Inc.)
- Trading as a Business Workshop
- VectorVest 7 EOD
- VectorVest 7 RealTime/IntraDay
- VectorVest AutoTester
- VectorVest Educational Services
- VectorVest OnLine
- VectorVest Options Analyzer
- VectorVest ProGraphics v6.0
- VectorVest ProTrader 7
- VectorVest RealTime Derby Tool
- VectorVest Simulator
- VectorVest Variator
- VectorVest Watchdog
