HOT TOPICS LIST
- MACD
- Fibonacci
- RSI
- Gann
- ADXR
- Stochastics
- Volume
- Triangles
- Futures
- Cycles
- Volatility
- ZIGZAG
- MESA
- Retracement
- Aroon
INDICATORS LIST
LIST OF TOPICS
PRINT THIS ARTICLE
by Austin Passamonte
Now that Santa's finished delivering Christmas gifts and the fruit cakes are eaten (or sitting curbside awaiting their final resting place) market bulls are awaiting one last gift: the vaunted Santa Claus rally.
Position: N/A
Austin Passamonte
Austin is a private trader who trades emini stock index futures intraday. He currently trades various futures markets from home in addition to managing a trader's educational forum
PRINT THIS ARTICLE
FLAGS AND PENNANTS
Flags Are Flying In The S&P Indexes
12/28/01 01:43:44 PMby Austin Passamonte
Now that Santa's finished delivering Christmas gifts and the fruit cakes are eaten (or sitting curbside awaiting their final resting place) market bulls are awaiting one last gift: the vaunted Santa Claus rally.
Position: N/A
| Theory has it that the last few days of December and beginning of January are a high-odds period of rising markets--Something to do with year-end window dressing by mutual funds, a practice none admit to but plenty accuse others of doing. |
| Regardless, when pondering near-term market direction I prefer to defer to the charts. Shall we? |

|
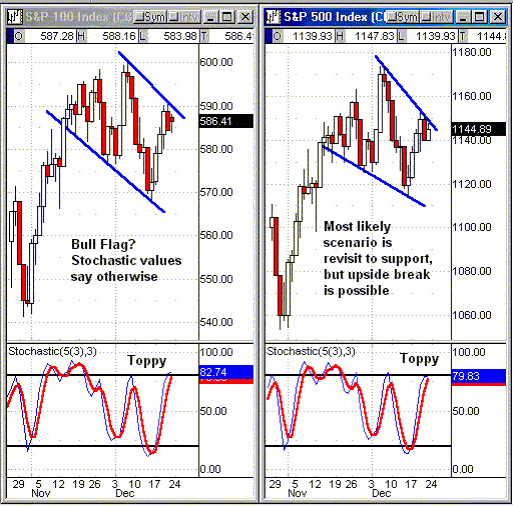
| Figure 1: Daily Charts: OEX & SPX |
| Graphic provided by: Quote.com. |
| Graphic provided by: QCharts. |
| |
Both S&P Indices, the OEX and SPX, look bullish by chart patterns, each showing a nearly completed bull flag formation. But they're looking bearish by their oscillators. What does such a mixed message suggest? A probable pullback within the patterns at least one more time as both weekly (not shown) and daily charts set up with their oscillators within overbought extreme zones here. |
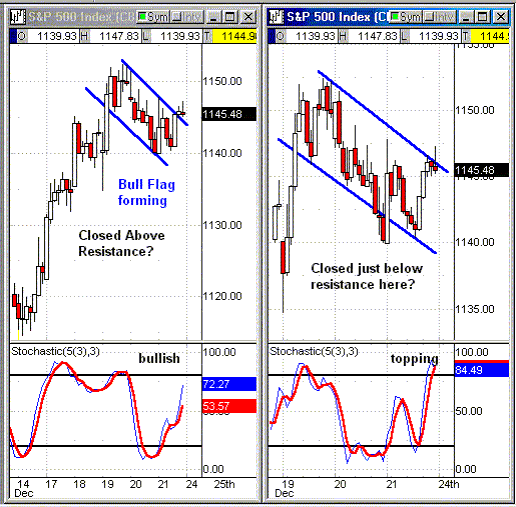
 Figure 2: 60/30 Min Chart: SPX The same thing is happening in their near-term intraday charts: bull flags and nearly overbought stochastic values. We could also connect all of the lows from Dec 19th and come up with neutral wedges as well, but that wouldn't really change the points of action very much. What next? That remains to be seen, but prices may bounce down near support levels and cause additional buying. From there, prices could pop higher followed by selling, or they could close outside of resistance and establish a new base for price action to work from. Keeping the chart pattern trendlines in place give us excellent anchor points to buy support and/or sell resistance should either come to fruition in harmony with stochastic value direction. Fruition? That reminds me... it's time for a trip to the front curb! |
Austin is a private trader who trades emini stock index futures intraday. He currently trades various futures markets from home in addition to managing a trader's educational forum
| Title: | Individual Trader |
| Company: | CoiledMarkets.com |
| Address: | PO Box 633 |
| Naples, NY 14512 | |
| Website: | coiledmarkets.com/blog |
| E-mail address: | austinp44@yahoo.com |
Traders' Resource Links | |
| CoiledMarkets.com has not added any product or service information to TRADERS' RESOURCE. | |
Click here for more information about our publications!
Comments
Date: 12/29/01Rank: 4Comment:
Date: 01/01/02Rank: Comment: don t you think it also looks like a head and shoulders ?
Date: 01/01/02Rank: 4Comment:
Date: 01/02/02Rank: 4Comment:
Date: 01/08/02Rank: 4Comment:

|

Request Information From Our Sponsors
- VectorVest, Inc.
- Executive Premier Workshop
- One-Day Options Course
- OptionsPro
- Retirement Income Workshop
- Sure-Fire Trading Systems (VectorVest, Inc.)
- Trading as a Business Workshop
- VectorVest 7 EOD
- VectorVest 7 RealTime/IntraDay
- VectorVest AutoTester
- VectorVest Educational Services
- VectorVest OnLine
- VectorVest Options Analyzer
- VectorVest ProGraphics v6.0
- VectorVest ProTrader 7
- VectorVest RealTime Derby Tool
- VectorVest Simulator
- VectorVest Variator
- VectorVest Watchdog
- StockCharts.com, Inc.
- Candle Patterns
- Candlestick Charting Explained
- Intermarket Technical Analysis
- John Murphy on Chart Analysis
- John Murphy's Chart Pattern Recognition
- John Murphy's Market Message
- MurphyExplainsMarketAnalysis-Intermarket Analysis
- MurphyExplainsMarketAnalysis-Visual Analysis
- StockCharts.com
- Technical Analysis of the Financial Markets
- The Visual Investor
