HOT TOPICS LIST
- MACD
- Fibonacci
- RSI
- Gann
- ADXR
- Stochastics
- Volume
- Triangles
- Futures
- Cycles
- Volatility
- ZIGZAG
- MESA
- Retracement
- Aroon
INDICATORS LIST
LIST OF TOPICS
PRINT THIS ARTICLE
by James Kupfer
The broad market indexes have tumbled significantly in the last few weeks, so how much lower can they go?
Position: Hold
James Kupfer
Mr. Kupfer is a market professional and amateur stock market commentator. Disclosure: It is likely that Mr. Kupfer has or will enter a position in any security he writes about.
PRINT THIS ARTICLE
FIBONACCI
Where To Now For The S&P 500?
05/25/10 08:28:32 AMby James Kupfer
The broad market indexes have tumbled significantly in the last few weeks, so how much lower can they go?
Position: Hold
| Over the last few weeks, I have posted a number of articles that used various Fibonacci measurements that foreshadowed the market's April top. Since April 26, the Standard & Poor's 500 has rapidly dropped from a high of 1219.80 to a low of 1055.90. Moreover, on May 6, the markets experienced the "flash crash," where the Dow Jones Industrial Average (DJIA) dropped almost 900 points on an intraday basis, and much of that drop occurred within a mere five to 15 minutes. |
| I mention this to show that the market has indeed put in a significant top, as the Fibonacci measurements projected. But is this the top that will mark the resumption of the bear market, or is this another buying opportunity? There are a number of reasons that I do not think that the April top was "the top." If April 23 marked a long-term top in the market or even if it did not, there will still be potential buying points if we continue to move lower. |

|
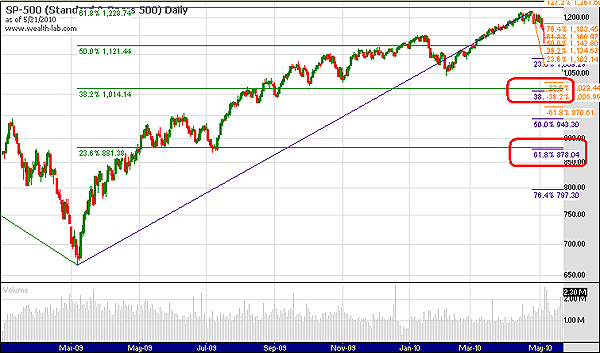
| FIGURE 1: S&P 500, DAILY. The red ellipses mark significant Fibonacci retracement zones for a strong support. |
| Graphic provided by: Wealth-Lab. |
| |
| In Figure 1, you can see a number of critical Fibonacci levels. The green lines are the retracement levels formed from the October 2007 high to the May 2009 bottom. The rest of the lines are shown clearly. First, focus on the two red ellipses since they show a convergence of the two longest-term Fibonacci retracements zones (green and blue lines). If the market does continue to drop, it will have a hard time breaking through those levels at 1010 and 880, respectively. |
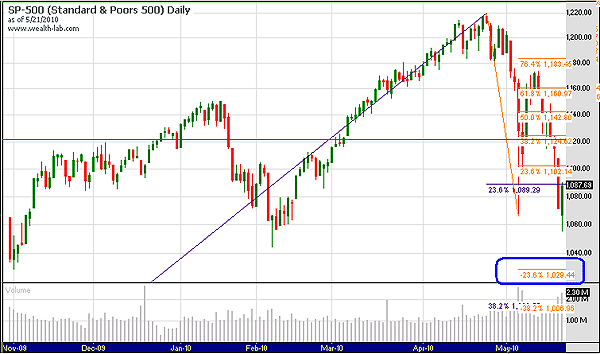
| Moving to the closeup chart (Figure 2), the next significant Fibonacci level is the 123.6% projection from the April top to the bottom of the "flash crash" day at 1029.44. While it is by no means a shorting opportunity, it is quite likely that the market will reach down to near that level. Below that, the market has strong support at the 1010 zone. |

|
| FIGURE 2: S&P 500, DAILY. The blue ellipse may be the next stopping point if the market continues down. |
| Graphic provided by: Wealth-Lab. |
| |
| The next few weeks will be critical in determining if April was the big top or today is a buying opportunity. A break below 1010 would significantly increase the chances, in my opinion, of April being the bear-in-a-bull top. If prices drop to between 1050-1030, it might also provide an attractive buying zone, which will be worth watching if the time comes. Either way, watch the major Fibonacci levels as potential buying zones if the market continues to drop. |
Mr. Kupfer is a market professional and amateur stock market commentator. Disclosure: It is likely that Mr. Kupfer has or will enter a position in any security he writes about.
Click here for more information about our publications!
Comments
Date: 05/26/10Rank: 4Comment:

Request Information From Our Sponsors
- StockCharts.com, Inc.
- Candle Patterns
- Candlestick Charting Explained
- Intermarket Technical Analysis
- John Murphy on Chart Analysis
- John Murphy's Chart Pattern Recognition
- John Murphy's Market Message
- MurphyExplainsMarketAnalysis-Intermarket Analysis
- MurphyExplainsMarketAnalysis-Visual Analysis
- StockCharts.com
- Technical Analysis of the Financial Markets
- The Visual Investor
- VectorVest, Inc.
- Executive Premier Workshop
- One-Day Options Course
- OptionsPro
- Retirement Income Workshop
- Sure-Fire Trading Systems (VectorVest, Inc.)
- Trading as a Business Workshop
- VectorVest 7 EOD
- VectorVest 7 RealTime/IntraDay
- VectorVest AutoTester
- VectorVest Educational Services
- VectorVest OnLine
- VectorVest Options Analyzer
- VectorVest ProGraphics v6.0
- VectorVest ProTrader 7
- VectorVest RealTime Derby Tool
- VectorVest Simulator
- VectorVest Variator
- VectorVest Watchdog
