HOT TOPICS LIST
- MACD
- Fibonacci
- RSI
- Gann
- ADXR
- Stochastics
- Volume
- Triangles
- Futures
- Cycles
- Volatility
- ZIGZAG
- MESA
- Retracement
- Aroon
INDICATORS LIST
LIST OF TOPICS
PRINT THIS ARTICLE
by Donald W. Pendergast, Jr.
A unique chart pattern is in the works on the Russell 2000 index's daily chart, a pattern that has a good track record at forecasting bullish reversals.
Position: N/A
Donald W. Pendergast, Jr.
Donald W. Pendergast is a financial markets consultant who offers specialized services to stock brokers and high net worth individuals who seek a better bottom line for their portfolios.
PRINT THIS ARTICLE
CHART ANALYSIS
Russell 2000 Bullish Gartley Pattern Forming
05/24/10 02:19:33 PMby Donald W. Pendergast, Jr.
A unique chart pattern is in the works on the Russell 2000 index's daily chart, a pattern that has a good track record at forecasting bullish reversals.
Position: N/A
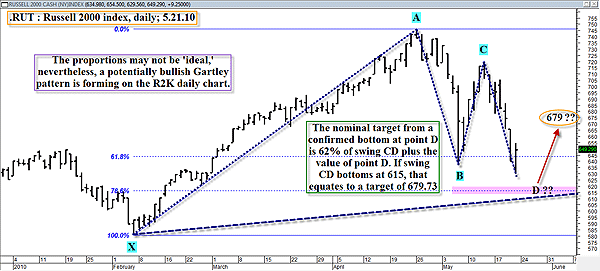
| The Gartley pattern is still relatively unknown to modern traders, even though it was first revealed to the financial world way back in the mid-1930s. H.M. Gartley identified the pattern that bears his name in his book Profits In The Stock Market, originally published in 1935. Essentially, a bullish Gartley pattern has several dynamics going for it: * A substantial uptrend completes (swing XA on Figure 1) * A lower high completes on a retracement move (swing BC) * A final low (swing CD) occurs at approximately 0.618 to 0.786 of the length of swing XA * Once swing CD completes near one of those retracement zones, expect a bounce higher of approximately 62% of the length of swing CD. If you've been reading my articles here in Traders.com Advantage recently, you already know that there is a very strong Fibonacci support area in the R2K at approximately 615.00, and that this support level occurs at a Gartley 79% retracement area. My premise is this: The slight bounce higher seen at the close of last week's trading session is destined to fail in short order, with much stronger bearish momentum in higher time frames very likely to drive the R2K down to test that key 615.00 support level within the next two weeks, the anticipated weekly cycle low for this key small-cap index. Further, if 615.00 is seen, and it does act as a reversal pivot, expect knowledgable traders and investors to go long this then-complete bullish Gartley pattern in a big way, possibly even driving the index back up toward the 670 to 680 area. See Figure 1. |

|
| FIGURE 1: RUT, DAILY. Some Gartley patterns are textbook quality, while others have a few warts and pimples. This one is more of a warts-and-all variety but still has incredible potential, especially if the swing CD bottoms and reverses near 615.00. If that happens, expect the big money to go long again, possibly driving prices toward 670 to 680. |
| Graphic provided by: MetaStock. |
| |
| Should this happen, does this mean that the bear market is over? While anything is possible in the financial markets, it's not likely that we'll be seeing the R2K at 745.00 or higher anytime soon again, much less a NASDAQ 5000. By almost all market volume and internal strength measures, we should more likely expect to see continued weakness until at least the end of August 2010, as the damage done to the technical structure of the incredible March 2009 to April 2010 bull run has been severe. Stock traders should focus on weak stocks in weak groups, attempting to locate low-risk put purchases, call sales, and naked shorting opportunities. Especially if we do get that Gartley reaction up toward 670 to 680, there could be many opportunities to short the market like a madman at those price areas. |
| This week could be important in the ongoing development of this unique (and frequently profitable) chart pattern. If last week's low (629.56) gives way in only a day or two, expect continued weakness down toward the vital support of 615.00. Expect continued high volatility as more news continues to emanate from the deeply troubled eurozone. The next two weeks into that anticipated weekly cycle low in the R2K should be very memorable, so be prepared for anything and everything during the next 10 trading sessions or so. |
Donald W. Pendergast is a financial markets consultant who offers specialized services to stock brokers and high net worth individuals who seek a better bottom line for their portfolios.
| Title: | Writer, market consultant |
| Company: | Linear Trading Systems LLC |
| Jacksonville, FL 32217 | |
| Phone # for sales: | 904-239-9564 |
| E-mail address: | lineartradingsys@gmail.com |
Traders' Resource Links | |
| Linear Trading Systems LLC has not added any product or service information to TRADERS' RESOURCE. | |
Click here for more information about our publications!
Comments

Request Information From Our Sponsors
- StockCharts.com, Inc.
- Candle Patterns
- Candlestick Charting Explained
- Intermarket Technical Analysis
- John Murphy on Chart Analysis
- John Murphy's Chart Pattern Recognition
- John Murphy's Market Message
- MurphyExplainsMarketAnalysis-Intermarket Analysis
- MurphyExplainsMarketAnalysis-Visual Analysis
- StockCharts.com
- Technical Analysis of the Financial Markets
- The Visual Investor
- VectorVest, Inc.
- Executive Premier Workshop
- One-Day Options Course
- OptionsPro
- Retirement Income Workshop
- Sure-Fire Trading Systems (VectorVest, Inc.)
- Trading as a Business Workshop
- VectorVest 7 EOD
- VectorVest 7 RealTime/IntraDay
- VectorVest AutoTester
- VectorVest Educational Services
- VectorVest OnLine
- VectorVest Options Analyzer
- VectorVest ProGraphics v6.0
- VectorVest ProTrader 7
- VectorVest RealTime Derby Tool
- VectorVest Simulator
- VectorVest Variator
- VectorVest Watchdog
