HOT TOPICS LIST
- MACD
- Fibonacci
- RSI
- Gann
- ADXR
- Stochastics
- Volume
- Triangles
- Futures
- Cycles
- Volatility
- ZIGZAG
- MESA
- Retracement
- Aroon
INDICATORS LIST
LIST OF TOPICS
PRINT THIS ARTICLE
by Donald W. Pendergast, Jr.
What a month! The big bad bull is on the run, but several key Fibonacci support levels may help stop the current slide.
Position: N/A
Donald W. Pendergast, Jr.
Donald W. Pendergast is a financial markets consultant who offers specialized services to stock brokers and high net worth individuals who seek a better bottom line for their portfolios.
PRINT THIS ARTICLE
FIBONACCI
Russell 2000 Potential Support Soon?
05/21/10 09:30:39 AMby Donald W. Pendergast, Jr.
What a month! The big bad bull is on the run, but several key Fibonacci support levels may help stop the current slide.
Position: N/A
| The R2K is at it again! As if the "flash crash" from a couple of weeks ago wasn't enough fun and games for already traumatized traders and investors, this key small-cap index shed another 80 points (about 11%) in just the last six trading sessions. The fact that today's (May 20, 2010) daily range was also the most extreme since the flash crash only seems to add to the urgency of the current market situation. Here's a brief examination of several key Fibonacci support ratios/confluence levels that may be expected to provide some semblance of a floor for this rapidly declining index. |

|
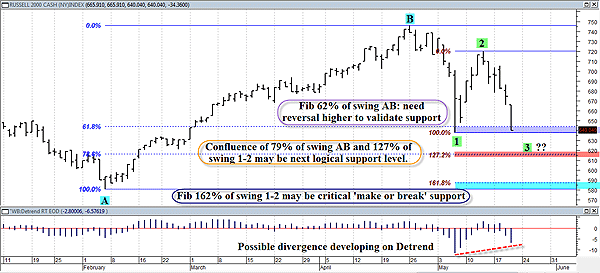
| FIGURE 1: RUSSELL 2000, DAILY. A break below the flash crash low of 637.69 could mean another flood of selling down toward the Fibonacci confluence zone near 615.00 (pink shaded area). |
| Graphic provided by: MetaStock. |
| Graphic provided by: WB Detrend RT EOD from ProfitTrader for MetaStock. |
| |
| As always, it's dangerous to predict exact turning points in any market, but there are a couple of interesting Fibonacci dynamics displayed on this daily chart of the Russell 2000 index (.RUT) that we can use to prepare for possible relief rally bounces (Figure 1). First off, note how quickly the massive February to April uptrend (swing AB) sold off into the Fibonacci 62% retracement level during the week of the flash crash. Since a bullish market that fails to hold support at the 62% level is usually considered to have marked the end of such a bull run, the action over the next few sessions is going to be very important, as another close below that line in the sand (near 644.00) is going to be viewed very negatively by market participants. After the fireworks of two weeks ago, the market had a healthy bounce higher (swing 1-2), but it fell far short of the April high of 745. The current downswing (swing 2-3) is still going south, and again, if you see a close below the 644.00 to 637.69 area, we may reasonably expect to see the R2K continue down to at least the Fibonacci 127% retracement of swing 1-2, which also happens to coincide with the Fibonacci 79% retracement of major swing AB, forming a significant Fibonacci confluence level near 615.00 (pink shaded area). Given that the WB detrend oscillator (bottom of chart) may be giving the first hints of a bullish divergence with price, the 615.00 area is one to keep an eye on in this particular market. Below that, the Fibonacci 162% retracement of swing 1-2 lies a little above the major February low (point A). This support zone goes from 587.00 to 590.49 and may very well be considered the major "make or break" for this market. Be advised that a major weekly cycle low is projected within the next two weeks (based on a typical 14- to 17-week cycle between major lows in the R2K), so we may already be afforded with a distant early warning to help us prepare our shopping lists for when the combined effect of all of these varies chart dynamics (cycles, Fibonacci confluence, and detrend divergence) finally coalesce to bring about the next major low. |

|
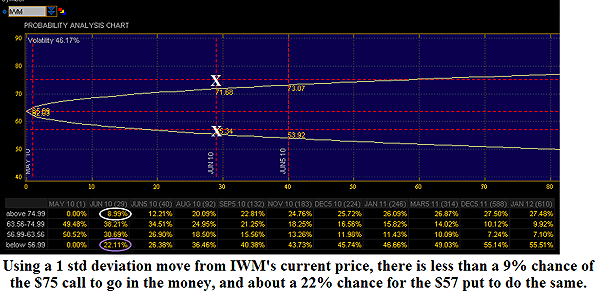
| FIGURE 2: IWM. Selling a strangle isn't as common an activity as slurping a Starbucks drink, but it might just buy quite a few lattes, especially if IWM stays between $75 and $57 by June 2010 option expiration. |
| Graphic provided by: Thinkorswim. |
| |
| With that said, let's examine a few possibilities for those looking to profit from the action to come in the next few weeks: Short Strangle in IWM Sell a June IWM 75/57 strangle for $1.62 ($162) or better. Both the call and put strikes are beyond the major support/resistance levels formed by major swing AB, and with option premiums highly inflated by the recent plunge, this appears to be a very attractive option play. Yes, putting the trade on here means you're a bit closer to the put strike ($57), but with such lovely heavy-duty SR barriers already in place, it's going to take quite a move to break that February low in one major move. Meanwhile, time decay will be eating away at both the put and call, possibly permitting you the luxury of even closing one side of the trade (or both sides) out before expiration. See Figure 2. If you see one of the options getting close to going in-the-money, just close that side of the trade out and roll out a further out-of-the-money put (call) if you're convinced that your market analysis is still on-the-money. If you've never sold a strangle before, it's no big deal, and the margins required are relatively low. Of course, low option commissions are a big plus; at Thinkorswim, selling one of these 75/57 June strangles will entail a commission of about $6. At Interactive Brokers, this trade would cost about $2. But if you're paying $15 or $20 per contract, then a short-term trade like this makes little sense, all else being equal. Talk to your broker, ask plenty of questions, and know the potential risks and rewards before putting this strangle on. |
Donald W. Pendergast is a financial markets consultant who offers specialized services to stock brokers and high net worth individuals who seek a better bottom line for their portfolios.
| Title: | Writer, market consultant |
| Company: | Linear Trading Systems LLC |
| Jacksonville, FL 32217 | |
| Phone # for sales: | 904-239-9564 |
| E-mail address: | lineartradingsys@gmail.com |
Traders' Resource Links | |
| Linear Trading Systems LLC has not added any product or service information to TRADERS' RESOURCE. | |
Click here for more information about our publications!
Comments
Date: 05/24/10Rank: 2Comment:

Request Information From Our Sponsors
- StockCharts.com, Inc.
- Candle Patterns
- Candlestick Charting Explained
- Intermarket Technical Analysis
- John Murphy on Chart Analysis
- John Murphy's Chart Pattern Recognition
- John Murphy's Market Message
- MurphyExplainsMarketAnalysis-Intermarket Analysis
- MurphyExplainsMarketAnalysis-Visual Analysis
- StockCharts.com
- Technical Analysis of the Financial Markets
- The Visual Investor
- VectorVest, Inc.
- Executive Premier Workshop
- One-Day Options Course
- OptionsPro
- Retirement Income Workshop
- Sure-Fire Trading Systems (VectorVest, Inc.)
- Trading as a Business Workshop
- VectorVest 7 EOD
- VectorVest 7 RealTime/IntraDay
- VectorVest AutoTester
- VectorVest Educational Services
- VectorVest OnLine
- VectorVest Options Analyzer
- VectorVest ProGraphics v6.0
- VectorVest ProTrader 7
- VectorVest RealTime Derby Tool
- VectorVest Simulator
- VectorVest Variator
- VectorVest Watchdog
