HOT TOPICS LIST
- MACD
- Fibonacci
- RSI
- Gann
- ADXR
- Stochastics
- Volume
- Triangles
- Futures
- Cycles
- Volatility
- ZIGZAG
- MESA
- Retracement
- Aroon
INDICATORS LIST
LIST OF TOPICS
PRINT THIS ARTICLE
by Koos van der Merwe
The question on everyone's minds today is the survival of the euro.
Position: Accumulate
Koos van der Merwe
Has been a technical analyst since 1969, and has worked as a futures and options trader with First Financial Futures in Johannesburg, South Africa.
PRINT THIS ARTICLE
ELLIOTT WAVE
The Euro Currency Share
05/19/10 08:46:49 AMby Koos van der Merwe
The question on everyone's minds today is the survival of the euro.
Position: Accumulate
| The euro started life as a currency that challenged the supremacy of the US dollar. However, with the recent economic crises in the United States, the US dollar declined against world currencies, an advantage to the US whose manufactured products now became more competitive on world markets — a major plus in its economic recovery, but the dollar suffered. With the economic crisis in Greece, which is one of the PIIGs (Portugal, Ireland, Italy, Greece), the euro has taken a bashing. French President Nicholas Sarkozy has hinted that France may consider leaving the euro zone and returning to the franc. Economists are even suggesting that a two-tier euro, Northern and Southern, may be the answer, with the more volatile Mediterranean countries having their own volatile currency. Having conservative Germany share a common currency with volatile Greece sounds more and more like a good idea turning into a bad mistake. When the euro was first formed, it appeared that Winston Churchill's dream of a unified Europe was gaining momentum. Then Britain decided not to join in the currency and to keep the pound, but did end up becoming a member of the European Union. Whatever the rumors that are out there, and there are plenty of them, what does the chart say? To answer this, rather than look at the euro itself, I suggest looking at the exchange traded fund, the euro currency shares (FXE). |

|
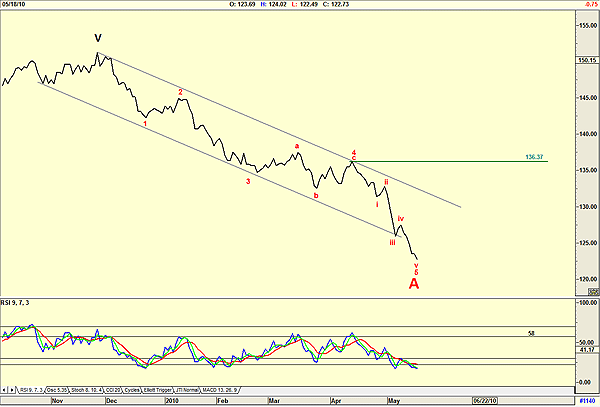
| FIGURE 1: FXE, DAILY |
| Graphic provided by: AdvancedGET. |
| |
| Figure 1, a daily chart, is suggesting that the euro currency share could be close to a bottom. When I hear CNBC's Rick Santelli shouting that the euro is being "clobbered" on every market today (May 18), then it sounds very much as if the euro is oversold. This is confirmed by the relative strength index (RSI), which is at oversold levels. However, the chart does show that in its slide, the RSI was more than often at oversold levels, and the sell signals given never came close to the 70 level but gave sell signals at 58. This confirmed the negative trend of the euro. Elliott wave analysis suggests that the euro could be completing a Wave A down in a five-wave pattern. If this is truly so, then we can expect a Wave B correction upward; that could follow an a-b-c-x-a-b-c pattern, at first guess to the 136.37 level, the wave 4 resistance pivot point. If this analysis is correct, and I write this as a reminder that Elliott wave analysis is only a signpost in the wilderness and can change at the next signpost, then a Wave C falling in five waves is yet to come, which could lead to the total dissolution of the euro as we know it today. This could be one of the reasons why all my previous market analysis suggests, that although the market is in a bull trend, it is going to be a slow and painful recovery. |
Has been a technical analyst since 1969, and has worked as a futures and options trader with First Financial Futures in Johannesburg, South Africa.
| Address: | 3256 West 24th Ave |
| Vancouver, BC | |
| Phone # for sales: | 6042634214 |
| E-mail address: | petroosp@gmail.com |
Click here for more information about our publications!
Comments
Date: 05/19/10Rank: 3Comment:

Request Information From Our Sponsors
- VectorVest, Inc.
- Executive Premier Workshop
- One-Day Options Course
- OptionsPro
- Retirement Income Workshop
- Sure-Fire Trading Systems (VectorVest, Inc.)
- Trading as a Business Workshop
- VectorVest 7 EOD
- VectorVest 7 RealTime/IntraDay
- VectorVest AutoTester
- VectorVest Educational Services
- VectorVest OnLine
- VectorVest Options Analyzer
- VectorVest ProGraphics v6.0
- VectorVest ProTrader 7
- VectorVest RealTime Derby Tool
- VectorVest Simulator
- VectorVest Variator
- VectorVest Watchdog
- StockCharts.com, Inc.
- Candle Patterns
- Candlestick Charting Explained
- Intermarket Technical Analysis
- John Murphy on Chart Analysis
- John Murphy's Chart Pattern Recognition
- John Murphy's Market Message
- MurphyExplainsMarketAnalysis-Intermarket Analysis
- MurphyExplainsMarketAnalysis-Visual Analysis
- StockCharts.com
- Technical Analysis of the Financial Markets
- The Visual Investor
