HOT TOPICS LIST
- MACD
- Fibonacci
- RSI
- Gann
- ADXR
- Stochastics
- Volume
- Triangles
- Futures
- Cycles
- Volatility
- ZIGZAG
- MESA
- Retracement
- Aroon
INDICATORS LIST
LIST OF TOPICS
PRINT THIS ARTICLE
by Alan R. Northam
The ProShares UltraShort Russell 2000 ETF is now in an upward trend. By using the Andrews pitchfork, we can determine an initial target price.
Position: N/A
Alan R. Northam
Alan Northam lives in the Dallas, Texas area and as an electronic engineer gave him an analytical mind from which he has developed a thorough knowledge of stock market technical analysis. His abilities to analyze the future direction of the stock market has allowed him to successfully trade of his own portfolio over the last 30 years. Mr. Northam is now retired and trading the stock market full time. You can reach him at inquiry@tradersclassroom.com or by visiting his website at http://www.tradersclassroom.com. You can also follow him on Twitter @TradersClassrm.
PRINT THIS ARTICLE
TECHNICAL ANALYSIS
Russell 2000 Inverse ETF Now In Uptrend
05/18/10 09:55:15 AMby Alan R. Northam
The ProShares UltraShort Russell 2000 ETF is now in an upward trend. By using the Andrews pitchfork, we can determine an initial target price.
Position: N/A
| The ProShares UltraShort Russell 2000 (TWM) is an exchange traded fund (ETF) that moves in the opposite direction as the Russell 2000 and is known as a bear fund. Bear funds allow traders with small-cash-only trading accounts to take part in bear market trends. By trading bear funds long during bear markets, bear market funds increase in value by allowing these traders to profit during bear markets. The ProShares UltraShort Russell 2000 ETF is also an ultra fund, meaning that it has a leverage of 2:1, so that it moves twice as fast as the Russell 2000 and traders need to take this into consideration when trading bear funds, as some bear funds move inversely 1 to 1 with the fund they track while ultra funds move 2 to 1. |

|
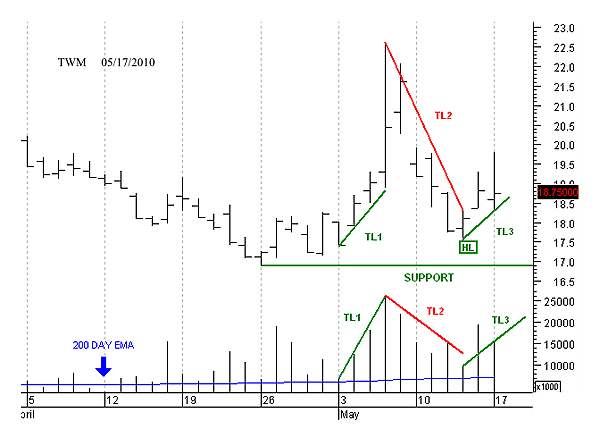
| FIGURE 1: TWM, DAILY |
| Graphic provided by: MetaStock. |
| |
| In Figure 1, the TWM put in a bottom on April 26 and put in a higher bottom on May 13, labeled HL on the chart. In addition, note the level of volume since the beginning of May and how it has increased tremendously compared to the 200-day exponential moving average (EMA) of volume. In addition, see that the 200-day EMA of volume is also starting to rise. Something important is going on with TWM. Further note that during the four-day rally from May 3 to May 6, the volume increased tremendously (see trendline TL1). During the selloff from May 7 to May 13, volume decreased drastically (see trendline TL2). Now note the last trading bar. This bar made a higher high and a high low compared to the low bar made on May 13, indicating that the downtrend starting from May 7 has ended. All TWM needs to do now is form a second bar with a higher high and a higher low to signal that a new uptrend has started (according to the Dow theory, an upward trend is identified as a series of trading bars making new higher highs and higher lows. The key here is the word "series"). Note that volume is again increasing as TWM is starting to move higher. So what is the important thing going on here? Volume is increasing on the rallies and decreasing on the selloffs. This is a bullish sign and indicates that TWM is in the process of reversing its trend from downward to upward. In addition, the failure of TWM in putting in a new lower low on May 6 when instead it made a higher low (labeled HL on the chart); it is also a sign that TWM is putting in a bottom. |

|
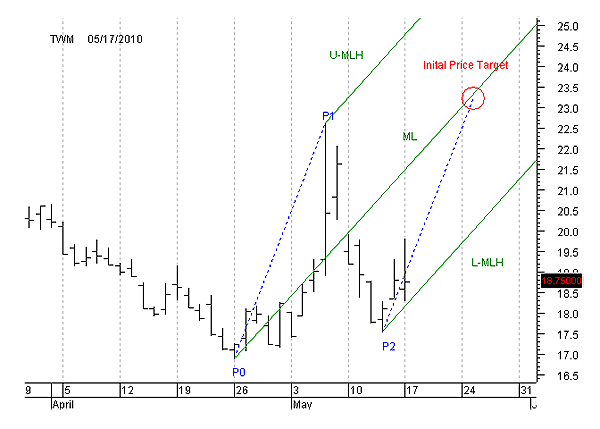
| FIGURE 2: TWM, DAILY. Here's the Andrews pitchfork and initial price target. |
| Graphic provided by: MetaStock. |
| |
| The first thing to do once a new trend has been determined is to identify the first three significant pivot points. I have shown these on Figure 2 and labeled them as P0, P1, and P2. Having identified these three significant pivot points, we can now draw in an Andrews pitchfork, which I have also shown on the chart. Further, I have drawn a blue dotted construction line between P0 and P1 and then projected this line off of P2. The point at which the second blue dotted construction line intersects with the pitchfork median line (ML) is an expected initial target price for TWM. According to the Andrews pitchfork theory, once price reaches the median line, a trend reversal can occur. However, the median line of the pitchfork also acts as a price magnet; and once price is attracted to it, price can travel along the median line for quite some time before actually reversing directions. Should price decide to continue higher once it hits the initial price target, Fibonacci extensions can be used to project the next target price point. |
Alan Northam lives in the Dallas, Texas area and as an electronic engineer gave him an analytical mind from which he has developed a thorough knowledge of stock market technical analysis. His abilities to analyze the future direction of the stock market has allowed him to successfully trade of his own portfolio over the last 30 years. Mr. Northam is now retired and trading the stock market full time. You can reach him at inquiry@tradersclassroom.com or by visiting his website at http://www.tradersclassroom.com. You can also follow him on Twitter @TradersClassrm.
| Garland, Tx | |
| Website: | www.tradersclassroom.com |
| E-mail address: | inquiry@tradersclassroom.com |
Click here for more information about our publications!
PRINT THIS ARTICLE

Request Information From Our Sponsors
- StockCharts.com, Inc.
- Candle Patterns
- Candlestick Charting Explained
- Intermarket Technical Analysis
- John Murphy on Chart Analysis
- John Murphy's Chart Pattern Recognition
- John Murphy's Market Message
- MurphyExplainsMarketAnalysis-Intermarket Analysis
- MurphyExplainsMarketAnalysis-Visual Analysis
- StockCharts.com
- Technical Analysis of the Financial Markets
- The Visual Investor
- VectorVest, Inc.
- Executive Premier Workshop
- One-Day Options Course
- OptionsPro
- Retirement Income Workshop
- Sure-Fire Trading Systems (VectorVest, Inc.)
- Trading as a Business Workshop
- VectorVest 7 EOD
- VectorVest 7 RealTime/IntraDay
- VectorVest AutoTester
- VectorVest Educational Services
- VectorVest OnLine
- VectorVest Options Analyzer
- VectorVest ProGraphics v6.0
- VectorVest ProTrader 7
- VectorVest RealTime Derby Tool
- VectorVest Simulator
- VectorVest Variator
- VectorVest Watchdog
