HOT TOPICS LIST
- MACD
- Fibonacci
- RSI
- Gann
- ADXR
- Stochastics
- Volume
- Triangles
- Futures
- Cycles
- Volatility
- ZIGZAG
- MESA
- Retracement
- Aroon
INDICATORS LIST
LIST OF TOPICS
PRINT THIS ARTICLE
by Austin Passamonte
Natural gas and related issues may be poised for an upswing. Here's a technical look at a few related issues.
Position: N/A
Austin Passamonte
Austin is a private trader who trades emini stock index futures intraday. He currently trades various futures markets from home in addition to managing a trader's educational forum
PRINT THIS ARTICLE
TECHNICAL ANALYSIS
A Spark For Natural Gas?
12/27/01 02:27:55 PMby Austin Passamonte
Natural gas and related issues may be poised for an upswing. Here's a technical look at a few related issues.
Position: N/A
| Recent price action in the energy sectors has seen dramatic declines off relative highs from the past year or so. Will current bargains in fuel stretch into the near future and beyond? |
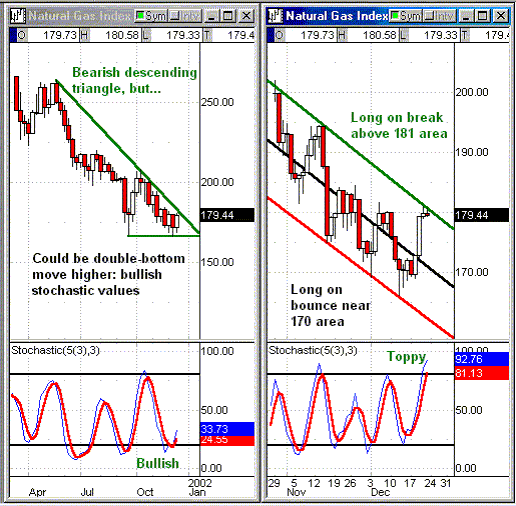
| Our weekly/daily chart view (Figure 1) of the AMEX Natural Gas Index shows that daily chart stochastic values are toppy and suggest another trip to support near 170 may be in store, but according to weekly charts that could be a gift entry for bullish plays near there. With the bottom of weekly chart triangle and daily chart mid-line channel both near the 170 zone, the XNG looks to have firm support in that area. |

|
| Figure 1: Weekly/Daily Charts: XNG |
| Graphic provided by: Quote.com. |
| Graphic provided by: QCharts. |
| |
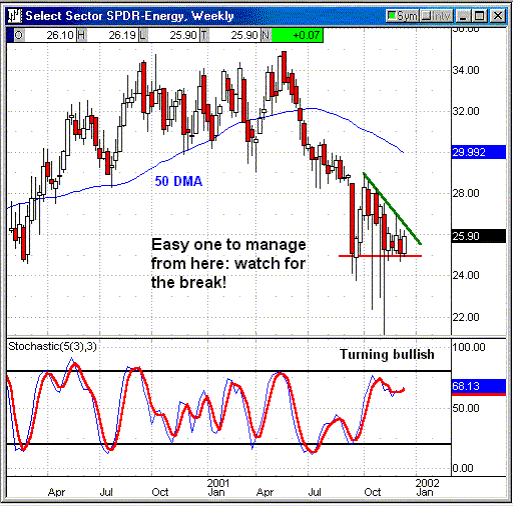
 Figure 2: Weekly Chart: XLE |
| How does one play such a move? Natural gas iShares listed on Amex as linked here: http://www.amex.com/asp/indexshares.asp?symbol=XLE This iShare has strong concentration of natural gas components and also lists option contracts as well. It has a good chance of popping the current sembalance of a triangle and testing the $30 level near its 50-DMA if natural gas catches fire and pops a bit from here. Supply & demand are the only two things that move price action in any market, and we are entering a strong seasonal period for energy. |
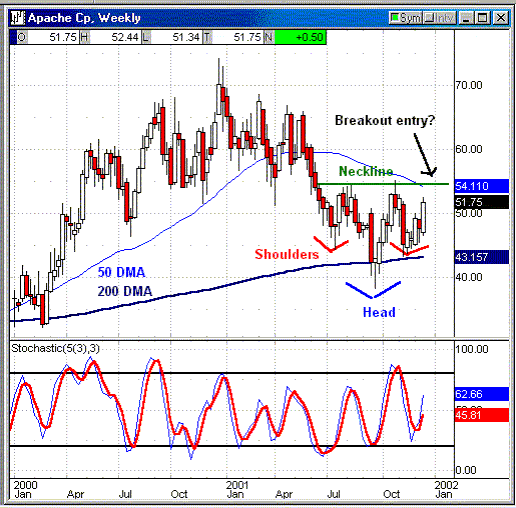
 Figure 3: Weekly Chart: APA Another natural gas & energy component is Apache Corp pictured above. Looks to us like it's forming a very distinct bullish head & shoulders reversal pattern. The inverted H&S neckline could be measured right near its 50-DMA, right above the 454 level and a clean break from there might find running room to $65 where recent resistance lies in wait. Stochastic values indicate upside pressure exists and may be released soon. With the coldest three-month period just ahead, we can almost hear those thermostats turning higher across the country and heating costs to follow suit. We might have seen the cheapest cubic feet already billed this winter and energy sector components strongly suggest higher prices are ahead. Watch For Coiled Markets! |
Austin is a private trader who trades emini stock index futures intraday. He currently trades various futures markets from home in addition to managing a trader's educational forum
| Title: | Individual Trader |
| Company: | CoiledMarkets.com |
| Address: | PO Box 633 |
| Naples, NY 14512 | |
| Website: | coiledmarkets.com/blog |
| E-mail address: | austinp44@yahoo.com |
Traders' Resource Links | |
| CoiledMarkets.com has not added any product or service information to TRADERS' RESOURCE. | |
Click here for more information about our publications!
Comments
Date: 12/30/01Rank: 5Comment:

|

Request Information From Our Sponsors
- StockCharts.com, Inc.
- Candle Patterns
- Candlestick Charting Explained
- Intermarket Technical Analysis
- John Murphy on Chart Analysis
- John Murphy's Chart Pattern Recognition
- John Murphy's Market Message
- MurphyExplainsMarketAnalysis-Intermarket Analysis
- MurphyExplainsMarketAnalysis-Visual Analysis
- StockCharts.com
- Technical Analysis of the Financial Markets
- The Visual Investor
- VectorVest, Inc.
- Executive Premier Workshop
- One-Day Options Course
- OptionsPro
- Retirement Income Workshop
- Sure-Fire Trading Systems (VectorVest, Inc.)
- Trading as a Business Workshop
- VectorVest 7 EOD
- VectorVest 7 RealTime/IntraDay
- VectorVest AutoTester
- VectorVest Educational Services
- VectorVest OnLine
- VectorVest Options Analyzer
- VectorVest ProGraphics v6.0
- VectorVest ProTrader 7
- VectorVest RealTime Derby Tool
- VectorVest Simulator
- VectorVest Variator
- VectorVest Watchdog
