HOT TOPICS LIST
- MACD
- Fibonacci
- RSI
- Gann
- ADXR
- Stochastics
- Volume
- Triangles
- Futures
- Cycles
- Volatility
- ZIGZAG
- MESA
- Retracement
- Aroon
INDICATORS LIST
LIST OF TOPICS
PRINT THIS ARTICLE
by Donald W. Pendergast, Jr.
Pfizer shares may be ready to move lower still, based on the trend dynamics on its daily and weekly charts.
Position: Sell
Donald W. Pendergast, Jr.
Donald W. Pendergast is a financial markets consultant who offers specialized services to stock brokers and high net worth individuals who seek a better bottom line for their portfolios.
PRINT THIS ARTICLE
TRADING SYSTEMS
Pfizer Bearish In Two Time Frames
05/17/10 10:15:31 AMby Donald W. Pendergast, Jr.
Pfizer shares may be ready to move lower still, based on the trend dynamics on its daily and weekly charts.
Position: Sell
| After peaking out in early January 2010, Pfizer (PFE) shares, one of the giant-cap stocks of the Standard & Poor's 500, have been gradually trending lower, down by more than $4 per share so far. With a fresh daily Rahul Mohindar oscillator (RMO) swing sell signal having just printed and the weekly chart already in a confirmed downtrend, everything looks like a go for potential short-sellers in this perennial pharmaceutical favorite. We'll look at PFE's daily chart first before analyzing its weekly chart, and then we'll examine a fairly low-risk way to go short PFE shares. |

|
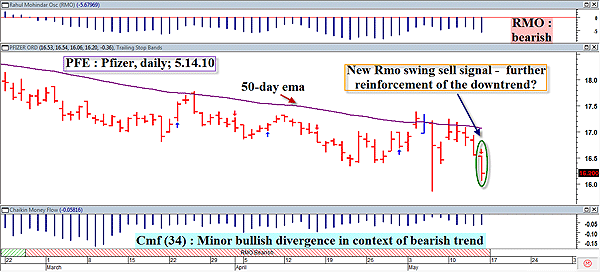
| FIGURE 1: PFE, DAILY. If the low of May 6, 2010, gives way ($15.85) gives way, PFE short-sellers might very well be rewarded with an all-expenses paid trip down to the Club $14 zone. |
| Graphic provided by: MetaStock. |
| Graphic provided by: Rahul Mohindar (RMO) tools from MetaStock v.11. |
| |
| PFE's daily chart (Figure 1) is grim enough to warrant the attention of aggressive short sellers, those confident that the stock still has some downside left. Of course, there are several technical indications that the stock is perhaps due for more travels on the south side of the market: * Daily money flow readings (Chaikin money flow [CMF][34]) have been negative for several months * The RMO is still heavily bearish * The new RMO swing sell signal helps add extra confidence * The downsloping 50-day exponential moving average (EMA) keeps acting as solid resistance, turning back each bear rally in the stock. So far, so good for those ready to go short in PFE shares. Let's make sure the higher time frame dynamics in PFE's weekly chart (Figure 2) are also in agreement with this short trade setup. |

|
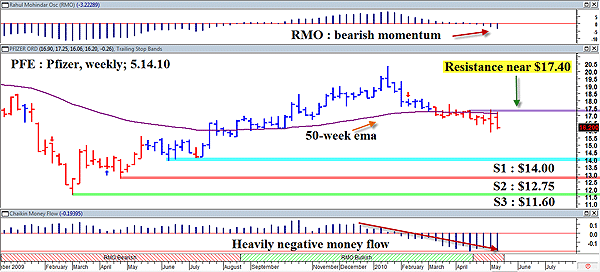
| FIGURE 2: PFE, WEEKLY. Once minor support near $15.60 is cleared, the stock has a clear shot at the $14 area, if not the $12.75 and $11.62 price zones. Note the horrific weekly money flow readings, a possible boon to long-term bears. |
| Graphic provided by: MetaStock. |
| Graphic provided by: Rahul Mohindar tools from MetaStock v.11. |
| |
| Now, the big picture, and it ain't good news for Pfizer bulls. First off, the 34-week money flow readings are abysmal; they're so low that they're liable to bump into the Fab Four in their Yellow Submarine if it gets any further underwater. Next, the 50-week EMA has been breached even as the RMO oscillator (top of chart) has begun to move more deeply into bearish territory. With very little in the way of significant chart support until $14 (blue line on chart), those going short near $16.20 (Friday's low) may be afforded with a reasonably painless way to go for a $2 per share gain, especially if the broad markets (.SPX, .NDX, .RUT) continue to weaken into the major weekly low that is expected to appear by early June. There is minor support for PFE near $15.60, but it is not expected to hold for any length of time unless the broad market suddenly turns around. Further south, we see that heavy-duty support levels also exist at the $12.75 and $11.60 price zones (red and green lines on chart). All in all, this is a terrific-looking short setup for experienced traders who use modest position sizing and strong self-discipline. |
| For a more detailed trading plan, here are a few ideas: Place a sell-stop near $16.04 for half your position and another sell-stop near $15.85 for the other half. When the first half is filled, place a buy-stop near $16.94 (Thursday's high). If the second half gets filled, start running a three-bar trailing stop of the daily highs until the $14 area is (hopefully) approached, at which point you would be well-advised to cover at least half of your short position (if not all of it, depending on how much of a cast-iron stomach you have). Should PFE continue to trek lower, start running a much closer two-bar trailing stop of the daily highs, closing out some more of your position if $12.75 is reached. Should the stock drop this far in a short period of time, the biggest danger for short-sellers is that of a violent short squeeze, so don't get upset if $11.62 isn't reached on this particular trend thrust lower. If you're running the two-bar trail of the highs, hopefully even a squeeze won't eviscerate too much of your open paper profits. The broad markets appear to be indicating that the major low of Thursday, May 6, 2010, still needs to be tested before the S&P 500 can continue to move higher. If this is true, then those going short Pfizer at this juncture may just find it to be the perfect trade at the perfect time. Just be sure to limit the risk to your trading account to 1% or 1.5% of its value so that no matter what happens, you can come back and trade another day. |
Donald W. Pendergast is a financial markets consultant who offers specialized services to stock brokers and high net worth individuals who seek a better bottom line for their portfolios.
| Title: | Writer, market consultant |
| Company: | Linear Trading Systems LLC |
| Jacksonville, FL 32217 | |
| Phone # for sales: | 904-239-9564 |
| E-mail address: | lineartradingsys@gmail.com |
Traders' Resource Links | |
| Linear Trading Systems LLC has not added any product or service information to TRADERS' RESOURCE. | |
Click here for more information about our publications!
PRINT THIS ARTICLE

Request Information From Our Sponsors
- StockCharts.com, Inc.
- Candle Patterns
- Candlestick Charting Explained
- Intermarket Technical Analysis
- John Murphy on Chart Analysis
- John Murphy's Chart Pattern Recognition
- John Murphy's Market Message
- MurphyExplainsMarketAnalysis-Intermarket Analysis
- MurphyExplainsMarketAnalysis-Visual Analysis
- StockCharts.com
- Technical Analysis of the Financial Markets
- The Visual Investor
- VectorVest, Inc.
- Executive Premier Workshop
- One-Day Options Course
- OptionsPro
- Retirement Income Workshop
- Sure-Fire Trading Systems (VectorVest, Inc.)
- Trading as a Business Workshop
- VectorVest 7 EOD
- VectorVest 7 RealTime/IntraDay
- VectorVest AutoTester
- VectorVest Educational Services
- VectorVest OnLine
- VectorVest Options Analyzer
- VectorVest ProGraphics v6.0
- VectorVest ProTrader 7
- VectorVest RealTime Derby Tool
- VectorVest Simulator
- VectorVest Variator
- VectorVest Watchdog
