HOT TOPICS LIST
- MACD
- Fibonacci
- RSI
- Gann
- ADXR
- Stochastics
- Volume
- Triangles
- Futures
- Cycles
- Volatility
- ZIGZAG
- MESA
- Retracement
- Aroon
INDICATORS LIST
LIST OF TOPICS
PRINT THIS ARTICLE
by Donald W. Pendergast, Jr.
When markets drop hard and fast, option volatilities can rise dramatically, and right now, option premiums are some of the fattest available since the market volatility of 2007 to 2009.
Position: N/A
Donald W. Pendergast, Jr.
Donald W. Pendergast is a financial markets consultant who offers specialized services to stock brokers and high net worth individuals who seek a better bottom line for their portfolios.
PRINT THIS ARTICLE
VOLATILITY
Option Volatility Surges In TNA
05/13/10 12:05:15 PMby Donald W. Pendergast, Jr.
When markets drop hard and fast, option volatilities can rise dramatically, and right now, option premiums are some of the fattest available since the market volatility of 2007 to 2009.
Position: N/A
| The small-cap market took a nasty tumble over the past three weeks or so, dropping the Russell 2000 index by as much as 14.5% between April 26, 2010, and May 6, 2010. My condolences if your unprotected long stock positions were mauled during the downdraft. We'll take a quick look at a few volatility measurements on TNA's daily graph and then see if we can't locate a couple of option sale trades, ones that may have an above-average chance of turning a profit. |

|
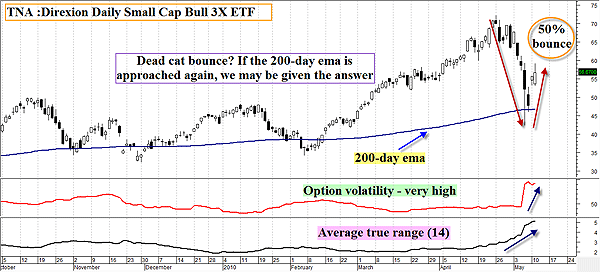
| FIGURE 1: TNA, DAILY. First the trounce, then the bounce. Even if buying or selling shares of TNA is a frightening proposition now, there are plenty of juicy short-term option premiums available for enterprising premium sellers. |
| Graphic provided by: MetaStock. |
| |
| As usual, the beloved 200-day exponential moving average (EMA) acted as a fairly strong (but not invulnerable) support level in TNA, allowing this triple-leveraged small-cap exchange traded fund (ETF) to retrace more than 50% of the plunge over the past three sessions (Figure 1). While it's still way too early to pick a direction for TNA on the daily time frame, it's actually a perfect time to start the hunt for low-risk, high-probability put and call sales. The reason for this, of course, is that fierce market selloffs invariably cause an inordinate demand for put options, driving the premiums way beyond any resembling fair value. Even better, in many cases even the call options for the plunging market in question will also get pumped up, allowing for low-risk call sales on options that are unlikely to ever get anywhere near in the money. We have two interesting volatility indicators displayed in Figure 1; the red line in the sub window is the option volatility indicator, and it's jumped noticeably over the past two weeks, as has the average true range indicator (ATR 14) plotted just beneath it. When we see such dramatic increases in either indicator, it's usually a good sign that option premiums have also jumped, making put and call sales an appealing activity. |

|
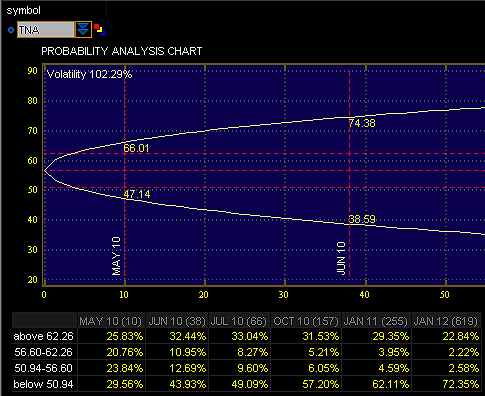
| FIGURE 2: TNA, PROBABILITY ANALYSIS. There is only a 25.83% chance (based on a one-standard deviation range) that TNA will close above $62.26 on May 21, options expiration. |
| Graphic provided by: Thinkorswim. |
| |
| Figure 2 is a probability analysis in ThinkorSwim, set up to determine the nominal probability that TNA will exceed and/or remain within a specified price range between now and May option expiration. Using a one standard deviation setting from the current price of $56.67, we find that there is only a 25.83% chance that TNA will be above $62.26 at May option expiration (May 21). So why not give ourselves a little extra protection and consider selling a call that is even further out of the money, such as the May 2010 $66 call for a credit of 0.55 or better? Even after a $3 commission, that's $52 of low-risk cash that gets immediately deposited into your margin account (per contract; if you can handle selling 10 of them, that's $520). You may need to wait for a minor intraday bounce in order to get a fill at this price, but the inconvenience of such a minor wait (if actually filled) should be more than worth it, given the low probability that TNA will actually close above $66 in a week and a half. See Figure 3. |

|
| FIGURE 3: TNA CALL. Selling a May 2010 $66 TNA call for at least $0.55 or better might be a low-risk, high-probability call option sale, given that only nine days remain until options expiration. |
| Graphic provided by: Thinkorswim. |
| |
| Market plunges don't happen everyday, but when they do, there's no need to be fearful or feel like a victim. Simply keep close tabs on option volatility levels and critical support/resistance levels in the markets you follow and then seek to put on low-risk, high-probability option put/call sales that are a good fit for your own risk tolerance situation. You will enjoy the experience, and so will your account's equity curve. |
Donald W. Pendergast is a financial markets consultant who offers specialized services to stock brokers and high net worth individuals who seek a better bottom line for their portfolios.
| Title: | Writer, market consultant |
| Company: | Linear Trading Systems LLC |
| Jacksonville, FL 32217 | |
| Phone # for sales: | 904-239-9564 |
| E-mail address: | lineartradingsys@gmail.com |
Traders' Resource Links | |
| Linear Trading Systems LLC has not added any product or service information to TRADERS' RESOURCE. | |
Click here for more information about our publications!
Comments

Request Information From Our Sponsors
- StockCharts.com, Inc.
- Candle Patterns
- Candlestick Charting Explained
- Intermarket Technical Analysis
- John Murphy on Chart Analysis
- John Murphy's Chart Pattern Recognition
- John Murphy's Market Message
- MurphyExplainsMarketAnalysis-Intermarket Analysis
- MurphyExplainsMarketAnalysis-Visual Analysis
- StockCharts.com
- Technical Analysis of the Financial Markets
- The Visual Investor
- VectorVest, Inc.
- Executive Premier Workshop
- One-Day Options Course
- OptionsPro
- Retirement Income Workshop
- Sure-Fire Trading Systems (VectorVest, Inc.)
- Trading as a Business Workshop
- VectorVest 7 EOD
- VectorVest 7 RealTime/IntraDay
- VectorVest AutoTester
- VectorVest Educational Services
- VectorVest OnLine
- VectorVest Options Analyzer
- VectorVest ProGraphics v6.0
- VectorVest ProTrader 7
- VectorVest RealTime Derby Tool
- VectorVest Simulator
- VectorVest Variator
- VectorVest Watchdog
