HOT TOPICS LIST
- MACD
- Fibonacci
- RSI
- Gann
- ADXR
- Stochastics
- Volume
- Triangles
- Futures
- Cycles
- Volatility
- ZIGZAG
- MESA
- Retracement
- Aroon
INDICATORS LIST
LIST OF TOPICS
PRINT THIS ARTICLE
by Koos van der Merwe
One lesson I have learned over the years is that when a major selloff occurs, a market bottom is usually signaled.
Position: Accumulate
Koos van der Merwe
Has been a technical analyst since 1969, and has worked as a futures and options trader with First Financial Futures in Johannesburg, South Africa.
PRINT THIS ARTICLE
ELLIOTT WAVE
Was Thursday, May 6's Selloff The End Of Wave II?
05/13/10 09:21:52 AMby Koos van der Merwe
One lesson I have learned over the years is that when a major selloff occurs, a market bottom is usually signaled.
Position: Accumulate
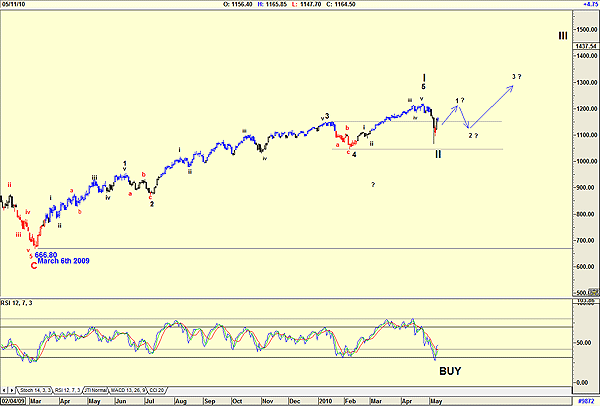
| Thursday, May 6 was a crazy day, with numerous theories to its cause. The reason for the strong selloff and recovery will one day be known, and something will be done to see that it never happens again, but for chartists it says one thing, and that is that the Wave II selloff is at an end, and the market should now be moving into Wave 1 of Wave III. The bull run ending in a Wave V should be a bull run that will last for at least six years, give or take one year. The strength of Wave II very much depends on the strength of Wave 1 of Wave III, a wave that I believe the market has now started to trace. |

|
| FIGURE 1: SPX. S&P 500 shows an expected trend. |
| Graphic provided by: AdvancedGET. |
| |
| Figure 1 is a chart of the Standard & Poor's 500 and shows how the index dropped with last Thursday's volatile market into the fourth wave of lesser degree, suggesting a turning point. I forecast this move in earlier analysis, but I believed that the correction would be a long-drawn-out correction lasting well into June, not the simple correction that has occurred. Wave 2 of Wave I looked like a simple a-b-c correction, which meant that Wave 4 of Wave I should have been a complicated correction, not the even simpler correction that actually occurred. Indexes may have values changed, but the correction is still there. Note how the relative strength index (RSI) has given a buy signal, confirming a bull market. As a matter of interest, WD Gann would have also pointed out that on May 11, Mercury was no longer retrograde, suggesting a positive move for the next few months. Once again, I suggest buying stocks on any correction, but look to those stocks that offer you a reasonable dividend yield. |
Has been a technical analyst since 1969, and has worked as a futures and options trader with First Financial Futures in Johannesburg, South Africa.
| Address: | 3256 West 24th Ave |
| Vancouver, BC | |
| Phone # for sales: | 6042634214 |
| E-mail address: | petroosp@gmail.com |
Click here for more information about our publications!
PRINT THIS ARTICLE

Request Information From Our Sponsors
- StockCharts.com, Inc.
- Candle Patterns
- Candlestick Charting Explained
- Intermarket Technical Analysis
- John Murphy on Chart Analysis
- John Murphy's Chart Pattern Recognition
- John Murphy's Market Message
- MurphyExplainsMarketAnalysis-Intermarket Analysis
- MurphyExplainsMarketAnalysis-Visual Analysis
- StockCharts.com
- Technical Analysis of the Financial Markets
- The Visual Investor
- VectorVest, Inc.
- Executive Premier Workshop
- One-Day Options Course
- OptionsPro
- Retirement Income Workshop
- Sure-Fire Trading Systems (VectorVest, Inc.)
- Trading as a Business Workshop
- VectorVest 7 EOD
- VectorVest 7 RealTime/IntraDay
- VectorVest AutoTester
- VectorVest Educational Services
- VectorVest OnLine
- VectorVest Options Analyzer
- VectorVest ProGraphics v6.0
- VectorVest ProTrader 7
- VectorVest RealTime Derby Tool
- VectorVest Simulator
- VectorVest Variator
- VectorVest Watchdog
