

HOT TOPICS LIST
- MACD
- Fibonacci
- RSI
- Gann
- ADXR
- Stochastics
- Volume
- Triangles
- Futures
- Cycles
- Volatility
- ZIGZAG
- MESA
- Retracement
- Aroon
INDICATORS LIST
LIST OF TOPICS
PRINT THIS ARTICLE
by Austin Passamonte
Here's the market analysis for the euro-USD spot currency market.
Position: N/A
Austin Passamonte
Austin is a private trader who trades emini stock index futures intraday. He currently trades various futures markets from home in addition to managing a trader's educational forum
PRINT THIS ARTICLE
TECHNICAL ANALYSIS
Appetite For Destruction
05/11/10 12:10:01 PMby Austin Passamonte
Here's the market analysis for the euro-USD spot currency market.
Position: N/A
| Pretty much everyone is well aware that a currency crisis exists. At least one nation that belongs to the euro is fiscally bankrupt, with several others in serious question of financial health. To say that all currency markets are alike is gently understating things. |
|
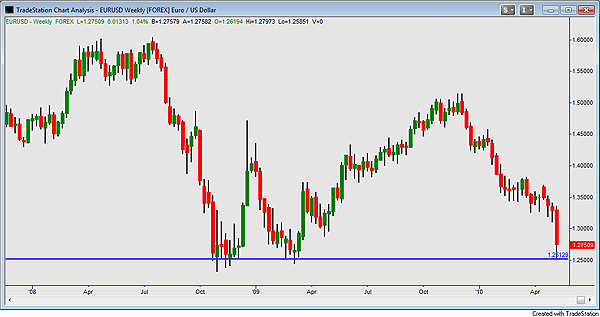
| FIGURE 1: EUR/USD, WEEKLY |
| Graphic provided by: TradeStation. |
| |
| The euro/US dollar (EUR/USD) pair has bumped recent bottoms near the 1.25 value since the bloody autumn of 2008. If this measure holds the latest selling swoon as a triple-bottom support, it should rebound strong in the mid-to long-term picture ahead. See Figure 1. |
| But the euro is in the early midst of a fundamental crisis, as noted everywhere in the media. These lines on a chart show where tipping zones of supply/demand exist while buyers and sellers remain mixed on their decision for what to do next. Any further breaking news of euro component weakness, downgrades of debt and so on, and support will melt like hot lava flowing through fresh butter. |
|
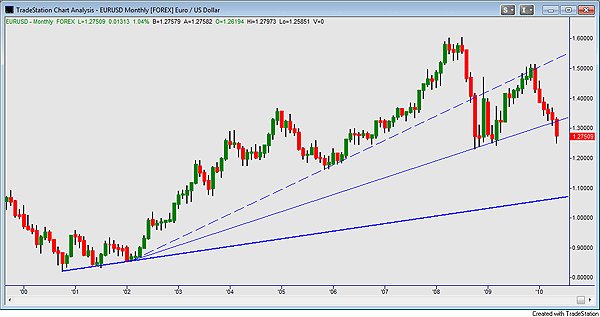
| FIGURE 2: EUR/USD, MONTHLY |
| Graphic provided by: TradeStation. |
| |
| A monthly chart view (Figure 2) shows where some seriously long-term trendlines of support have been containing price for the past year and a half and counting. October through December 2008 and January through March 2009 created a trendline of lows support that was likewise tested on the close of April 2010. I'd say that's pretty firm terra there -- or now. The early part of May 2010 (the time of this writing) has breached that solid support and needs to find some serious legs for a monthly close back above that mark. |
| We're in the early stages of the euro's biggest crisis ever. Whether it remains contained or blows way out of relative parameters ahead remains to be seen. Lines on the charts represent zones of supply/demand waiting to react accordingly. Stay tuned for an explosive story line this summer. |
Austin is a private trader who trades emini stock index futures intraday. He currently trades various futures markets from home in addition to managing a trader's educational forum
| Title: | Individual Trader |
| Company: | CoiledMarkets.com |
| Address: | PO Box 633 |
| Naples, NY 14512 | |
| Website: | coiledmarkets.com/blog |
| E-mail address: | austinp44@yahoo.com |
Traders' Resource Links | |
| CoiledMarkets.com has not added any product or service information to TRADERS' RESOURCE. | |
Click here for more information about our publications!
Comments
Date:�05/14/10Rank:�5Comment:�
Date:�05/18/10Rank:�3Comment:�

Request Information From Our Sponsors
- StockCharts.com, Inc.
- Candle Patterns
- Candlestick Charting Explained
- Intermarket Technical Analysis
- John Murphy on Chart Analysis
- John Murphy's Chart Pattern Recognition
- John Murphy's Market Message
- MurphyExplainsMarketAnalysis-Intermarket Analysis
- MurphyExplainsMarketAnalysis-Visual Analysis
- StockCharts.com
- Technical Analysis of the Financial Markets
- The Visual Investor
- VectorVest, Inc.
- Executive Premier Workshop
- One-Day Options Course
- OptionsPro
- Retirement Income Workshop
- Sure-Fire Trading Systems (VectorVest, Inc.)
- Trading as a Business Workshop
- VectorVest 7 EOD
- VectorVest 7 RealTime/IntraDay
- VectorVest AutoTester
- VectorVest Educational Services
- VectorVest OnLine
- VectorVest Options Analyzer
- VectorVest ProGraphics v6.0
- VectorVest ProTrader 7
- VectorVest RealTime Derby Tool
- VectorVest Simulator
- VectorVest Variator
- VectorVest Watchdog