HOT TOPICS LIST
- MACD
- Fibonacci
- RSI
- Gann
- ADXR
- Stochastics
- Volume
- Triangles
- Futures
- Cycles
- Volatility
- ZIGZAG
- MESA
- Retracement
- Aroon
INDICATORS LIST
LIST OF TOPICS
PRINT THIS ARTICLE
by Austin Passamonte
Here's a market outlook for the crude oil futures index.
Position: N/A
Austin Passamonte
Austin is a private trader who trades emini stock index futures intraday. He currently trades various futures markets from home in addition to managing a trader's educational forum
PRINT THIS ARTICLE
TECHNICAL ANALYSIS
Drilling Range For Crude Oil Futures
05/11/10 12:03:29 PMby Austin Passamonte
Here's a market outlook for the crude oil futures index.
Position: N/A
| Crude oil has the unique distinction of being a consumable commodity product and a quasicurrency market in rather equal balance. The effects on crude oil pricing are part supply/demand and part US dollar value offsets. |

|
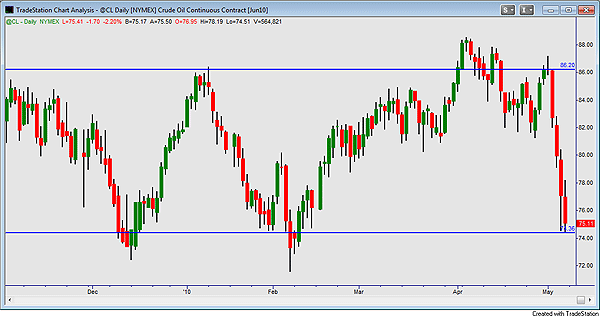
| FIGURE 1: CRUDE OIL FUTURES, DAILY |
| Graphic provided by: TradeStation. |
| |
| That being said, crude oil futures have generally rolled through a sideways range from roughly $74 to $86 per barrel since October 2009 with brief blips outside either extreme (Figure 1). The recent power dive that sent crude prices $13 bbl lower inside of five trading sessions spanned the entire range. We can see where the 74+ mark served as low zone supports in December 2009 and February 2010 before popping to subsequent highs each time. We'll see how this trip resolves itself, accordingly or otherwise. |

|
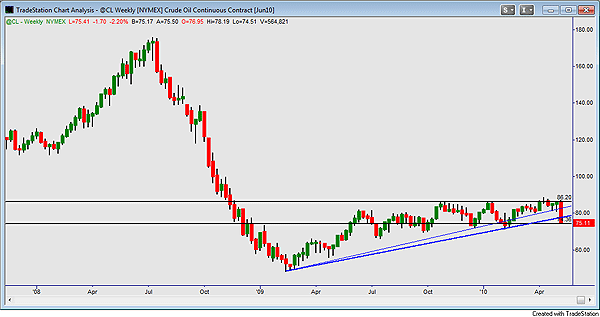
| FIGURE 2: CRUDE OIL FUTURES, WEEKLY |
| Graphic provided by: TradeStation. |
| |
| Dialing out to the weekly chart view (Figure 2), the same sideways channel shows clear persistence dating back more than a year. Meanwhile, vertical trendlines of support can be seen from bottom lows to higher-swing lows along the way. Both levels were broken on a weekly close basis and now appear to be overhead resistance until proven otherwise. |

|
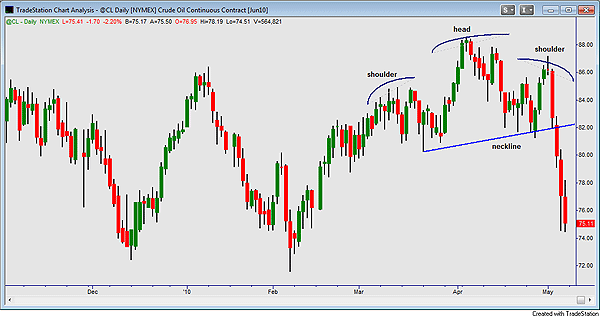
| FIGURE 3: CRUDE OIL FUTURES, DAILY |
| Graphic provided by: TradeStation. |
| |
| Back inside the daily chart for CL (Figure 3), we see a bearish head & shoulders formation with crown to neckline roughly $7 in width from 89 to 82 levels. That projects $7 down from crown to low objective or about the $75 mark extended. Bottom of the channel dating back for a year is the bottom of the H&S pattern projection. There is a sticky magnet near the $75 zone. If CL continues to trend lower from here, look for that clustered magnet zone of prior support to then become equally strong resistance. |
Austin is a private trader who trades emini stock index futures intraday. He currently trades various futures markets from home in addition to managing a trader's educational forum
| Title: | Individual Trader |
| Company: | CoiledMarkets.com |
| Address: | PO Box 633 |
| Naples, NY 14512 | |
| Website: | coiledmarkets.com/blog |
| E-mail address: | austinp44@yahoo.com |
Traders' Resource Links | |
| CoiledMarkets.com has not added any product or service information to TRADERS' RESOURCE. | |
Click here for more information about our publications!
Comments
Date: 05/11/10Rank: 5Comment:

Request Information From Our Sponsors
- VectorVest, Inc.
- Executive Premier Workshop
- One-Day Options Course
- OptionsPro
- Retirement Income Workshop
- Sure-Fire Trading Systems (VectorVest, Inc.)
- Trading as a Business Workshop
- VectorVest 7 EOD
- VectorVest 7 RealTime/IntraDay
- VectorVest AutoTester
- VectorVest Educational Services
- VectorVest OnLine
- VectorVest Options Analyzer
- VectorVest ProGraphics v6.0
- VectorVest ProTrader 7
- VectorVest RealTime Derby Tool
- VectorVest Simulator
- VectorVest Variator
- VectorVest Watchdog
- StockCharts.com, Inc.
- Candle Patterns
- Candlestick Charting Explained
- Intermarket Technical Analysis
- John Murphy on Chart Analysis
- John Murphy's Chart Pattern Recognition
- John Murphy's Market Message
- MurphyExplainsMarketAnalysis-Intermarket Analysis
- MurphyExplainsMarketAnalysis-Visual Analysis
- StockCharts.com
- Technical Analysis of the Financial Markets
- The Visual Investor
