HOT TOPICS LIST
- MACD
- Fibonacci
- RSI
- Gann
- ADXR
- Stochastics
- Volume
- Triangles
- Futures
- Cycles
- Volatility
- ZIGZAG
- MESA
- Retracement
- Aroon
INDICATORS LIST
LIST OF TOPICS
PRINT THIS ARTICLE
by Austin Passamonte
Here's a market outlook for the Dow Jones Industrial Average.
Position: N/A
Austin Passamonte
Austin is a private trader who trades emini stock index futures intraday. He currently trades various futures markets from home in addition to managing a trader's educational forum
PRINT THIS ARTICLE
TECHNICAL ANALYSIS
Bear's Best Friend
05/10/10 09:44:19 AMby Austin Passamonte
Here's a market outlook for the Dow Jones Industrial Average.
Position: N/A
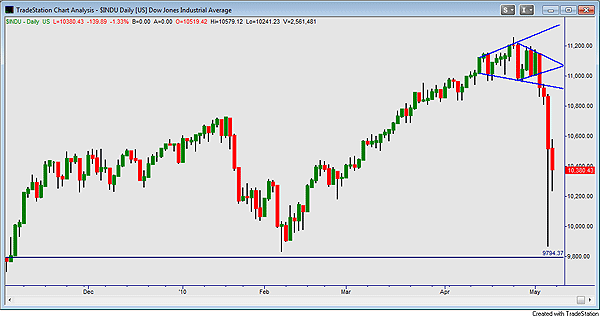
| From the March lows beneath 9900 through the May highs of 11,200+ swing extremes, the Dow Jones Industrial Average (DJIA) appeared to be on course for new all-time highs without pause. Then we watched the price action start to expand daily volume and ranges in a pretty clear diamond-pattern wedge. |

|
| FIGURE 1: INDU, DAILY |
| Graphic provided by: TradeStation. |
| |
| Diamond patterns are a formation of instability that usually (but not always) resolve downside. These diamond-shaped patterns are usually a market bear's best friend. This case has been one of the majority instances where expanding price in the first half contracted itself into an apex wedge before breaking through support and heading off to price discovery lower. See Figure 1. |
| The historical intraday range within Thursday, May 6, 2010, drop from high to low has been blamed on a number of causes that fell like dominos. Regardless, the index found a bottom near February 2010 lows and snapped back up to finish somewhere in the middle of its overall range from 2010 lows to highs. |

|
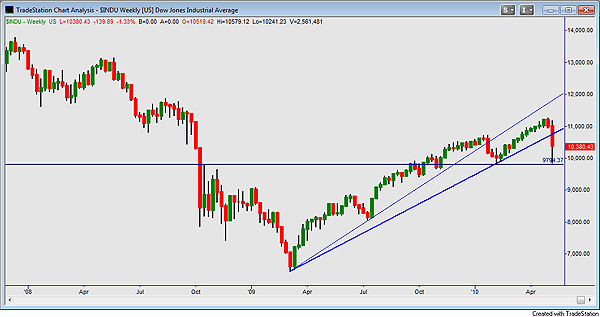
| FIGURE 2: INDU, WEEKLY |
| Graphic provided by: TradeStation. |
| |
| Dow 9800 level has been pivotal on a long-term chart basis since October 2008. Long-term trendlines from March 2009 lows to higher-low pullback swings since then were breached on heavy volume with gusto this past week. The DJIA is roughly 400 index points above that critical 9800 zone clearly defined on the chart. See Figure 2. |
| The blue-chip index has a lot of upside work above if recent highs are to be recovered before revisiting long-term lows again. Markets usually sustain trend moves through double-bottom or lower-high pullback retests of major lows. The v-turn bottom from early March 2009 has had no real test of validity at all. Unless the DJIA finds volume aplenty upside from here, we probably see a test of uptrend resolve in the summer months ahead. |
Austin is a private trader who trades emini stock index futures intraday. He currently trades various futures markets from home in addition to managing a trader's educational forum
| Title: | Individual Trader |
| Company: | CoiledMarkets.com |
| Address: | PO Box 633 |
| Naples, NY 14512 | |
| Website: | coiledmarkets.com/blog |
| E-mail address: | austinp44@yahoo.com |
Traders' Resource Links | |
| CoiledMarkets.com has not added any product or service information to TRADERS' RESOURCE. | |
Click here for more information about our publications!
Comments
Date: 05/11/10Rank: 5Comment:

Request Information From Our Sponsors
- StockCharts.com, Inc.
- Candle Patterns
- Candlestick Charting Explained
- Intermarket Technical Analysis
- John Murphy on Chart Analysis
- John Murphy's Chart Pattern Recognition
- John Murphy's Market Message
- MurphyExplainsMarketAnalysis-Intermarket Analysis
- MurphyExplainsMarketAnalysis-Visual Analysis
- StockCharts.com
- Technical Analysis of the Financial Markets
- The Visual Investor
- VectorVest, Inc.
- Executive Premier Workshop
- One-Day Options Course
- OptionsPro
- Retirement Income Workshop
- Sure-Fire Trading Systems (VectorVest, Inc.)
- Trading as a Business Workshop
- VectorVest 7 EOD
- VectorVest 7 RealTime/IntraDay
- VectorVest AutoTester
- VectorVest Educational Services
- VectorVest OnLine
- VectorVest Options Analyzer
- VectorVest ProGraphics v6.0
- VectorVest ProTrader 7
- VectorVest RealTime Derby Tool
- VectorVest Simulator
- VectorVest Variator
- VectorVest Watchdog
