HOT TOPICS LIST
- MACD
- Fibonacci
- RSI
- Gann
- ADXR
- Stochastics
- Volume
- Triangles
- Futures
- Cycles
- Volatility
- ZIGZAG
- MESA
- Retracement
- Aroon
INDICATORS LIST
LIST OF TOPICS
PRINT THIS ARTICLE
by Austin Passamonte
Here's a market analysis for the Standard & Poor's 500.
Position: N/A
Austin Passamonte
Austin is a private trader who trades emini stock index futures intraday. He currently trades various futures markets from home in addition to managing a trader's educational forum
PRINT THIS ARTICLE
TECHNICAL ANALYSIS
S&P Seatbelts
05/10/10 09:33:31 AMby Austin Passamonte
Here's a market analysis for the Standard & Poor's 500.
Position: N/A
| US stock markets have covered plenty of ground since May 2008. That month's index high was SPX 1440 on May 19. In the 24 months since, price has fallen to lows of 666 in March 2009 and rallied back in grinding fashion to recent highs of 1219. |

|
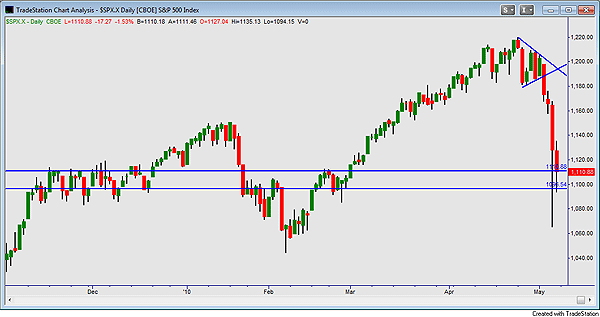
| FIGURE 1: SPX, DAILY |
| Graphic provided by: TradeStation. |
| |
| In the grinding rally of the past year, as price walked straight up the chart in this daily bar's view, volume and volatility dwindled away. From the second half of April through the first few sessions in May 2010, price formed an apex wedge (as shown in Figure 1) as the second part of a diamond pattern (not shown) when intraday ranges began expanding. This pattern of instability warns of powerful breaks to come. And indeed the pending break was — including the largest intraday range for the S&P 500 in two years. |
| SPX index has retraced all of its upward progress since February 2010 and is right back to the starting point of September–October 2008. In other words, everything and anything that happened inside the markets since then meant nothing at all to where it rests today. |

|
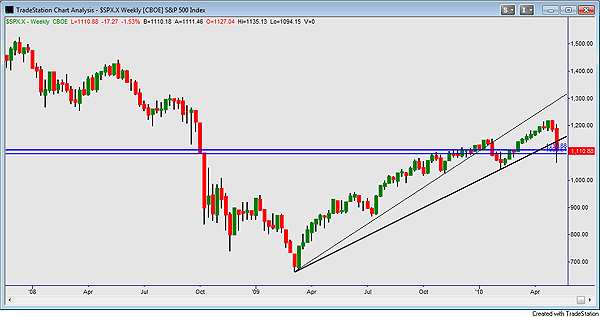
| FIGURE 2: SPX, WEEKLY |
| Graphic provided by: TradeStation. |
| |
| Dialing out to the weekly chart view (Figure 2), S&P 500 is resting on clustered horizontal support dating back to the crash of 2008. This appears to be the last port of call for northbound ships before they sail off the edges of a flat Earth. Long-term vertical trendlines dating back to Mar 2009 lows have both been breached on a weekly close basis. Unless the index bases right here and musters the energy to clamber back above those lines overhead, SPX 1000 and lower are most probable. |
| Nil volume markets always go up like feathers and come right back down like lead balloons, just another case in point this time around in the US stock indexes. Lines in the sand are clearly drawn from price point to price point for all to see. Fasten your seatbelts, and prepare for the potential of a wild summer's ride. |
Austin is a private trader who trades emini stock index futures intraday. He currently trades various futures markets from home in addition to managing a trader's educational forum
| Title: | Individual Trader |
| Company: | CoiledMarkets.com |
| Address: | PO Box 633 |
| Naples, NY 14512 | |
| Website: | coiledmarkets.com/blog |
| E-mail address: | austinp44@yahoo.com |
Traders' Resource Links | |
| CoiledMarkets.com has not added any product or service information to TRADERS' RESOURCE. | |
Click here for more information about our publications!
PRINT THIS ARTICLE

Request Information From Our Sponsors
- VectorVest, Inc.
- Executive Premier Workshop
- One-Day Options Course
- OptionsPro
- Retirement Income Workshop
- Sure-Fire Trading Systems (VectorVest, Inc.)
- Trading as a Business Workshop
- VectorVest 7 EOD
- VectorVest 7 RealTime/IntraDay
- VectorVest AutoTester
- VectorVest Educational Services
- VectorVest OnLine
- VectorVest Options Analyzer
- VectorVest ProGraphics v6.0
- VectorVest ProTrader 7
- VectorVest RealTime Derby Tool
- VectorVest Simulator
- VectorVest Variator
- VectorVest Watchdog
- StockCharts.com, Inc.
- Candle Patterns
- Candlestick Charting Explained
- Intermarket Technical Analysis
- John Murphy on Chart Analysis
- John Murphy's Chart Pattern Recognition
- John Murphy's Market Message
- MurphyExplainsMarketAnalysis-Intermarket Analysis
- MurphyExplainsMarketAnalysis-Visual Analysis
- StockCharts.com
- Technical Analysis of the Financial Markets
- The Visual Investor
