HOT TOPICS LIST
- MACD
- Fibonacci
- RSI
- Gann
- ADXR
- Stochastics
- Volume
- Triangles
- Futures
- Cycles
- Volatility
- ZIGZAG
- MESA
- Retracement
- Aroon
INDICATORS LIST
LIST OF TOPICS
PRINT THIS ARTICLE
by Dennis D. Peterson
While RSI is limited in its application, it does share characteristics in common with other measures. Learning an effective way of overcoming those limitations could be beneficial.
Position: N/A
Dennis D. Peterson
Market index trading on a daily basis.
PRINT THIS ARTICLE
REL. STR OSCILL
Relative Strength Index
01/04/02 01:45:57 PMby Dennis D. Peterson
While RSI is limited in its application, it does share characteristics in common with other measures. Learning an effective way of overcoming those limitations could be beneficial.
Position: N/A
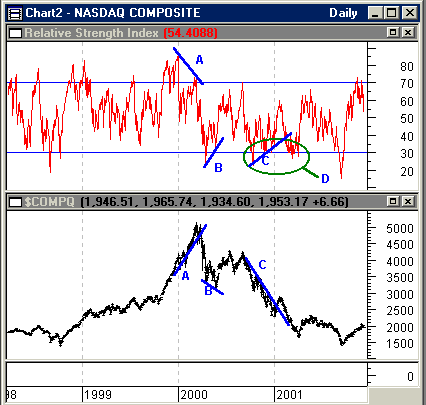
| I am going to analyze the Nasdaq composite using RSI, an oscillator. The three attributes of oscillators are: (1) divergence between oscillator and price trend, (2) signaling overbought and oversold conditions, and (3) a change in momentum as the oscillator comes from an extreme and crosses the midpoint between the overbought and oversold thresholds. The most powerful of these is divergence. This is especially true as you will see with RSI-type measures. If you look at the Nasdaq Composite you can see that there were several legitimate instances when RSI trend had a divergence with price trend (Figure 1: trends A, B, and C). It did do what an oscillator should do-- point out divergences by having the oscillator trend going up (down) when price trend is going down (up). Divergences are a leading indicator of a price trend change and therefore a highly desired piece of information. But my problem has always been that when I look at RSI trends, like trend A, which is defined by a peak at the beginning of January 2000 and a lower one in March 2000, they give me a price divergence. But between January and March a series of smaller RSI peaks are rising, which are not. For reasonable reliability you need to restrict RSI to only major highs and major lows. Maybe the right word to use is reasonable interpretation and not reliability. Whatever word you choose, it makes me wary of using RSI, except when I can see that a stock or commodity is reaching for a major peak or valley. But usually exhaustion patterns tell me the same thing about as often anyway. So why bother with RSI? Oscillators can also provide signals of overbought and oversold conditions. Clearly there are times when RSI is saying oversold (Figure 1: green oval D) or overbought, but you have to use another indicator to make a decision. For example, you could go long on oversold, RSI below or touching 30, but then what do you use to exit your position? StochRSI is a better choice. |
| While you can find fault and find a variation of RSI that will work better, there is something interesting in the way RSI does its measuring. It separates data by the number of up days and down days. Taking the ratio of the data for up days and down days causes RSI to oscillate. So if you take the ratio of up and down volume you should get something that oscillates, and you do. In fact if you take the ratio of advancing and declining issues, using advancers/(advancers+decliners), it oscillates too. But what we usually do is take advancers-decliners, ala McClellan, which of course oscillates. Interesting isn't it that for a 14-day RSI we don't worry when exactly the up days occurred, sooner versus later, or if they all came at once. It makes no difference in the answer. Somehow that doesn't seem right. Ever wonder - does it make a difference? To answer this question I started by charting the RSIs of seven, 14, and 21-day periods. If up days, or down days, are bunched together, an RSI of seven days will see it much more clearly than one of 14 or 21-days. What I expected to see is in fact what occurred. An RSI of seven days moved to extremes of 90 often when the up days came in bunches. Similarly, the seven-day RSI would reach for the lower extreme of 10 when down days came in bunches. An RSI of 14 days typically ranges between extremes of 30 and 70. And of course by using a seven-day period RSI I am using more recent data than that used by a 14-day period RSI. When I looked at how the three RSIs (seven, 14, and 21-days) moved relative to one another, it looked as though I could use the crossing of the seven and 14-day RSIs to signal entry and exit for long and shorts -- go long when the seven-day RSI was greater than the 14-day and short when it was less. When I did this, I realized I needed to make sure that when the seven-day RSI crossed above, or below, the 14-day average, it didn't just get above, or below, by a small amount. Therefore, I added a variable called "adjust" seen below. You will also see that I made the amount of adjustment a function of how close the 14 and 21-day RSI values are in an attempt to have a variable adjustment and provide a cross made by some minimum amount. |

|
| Figure 1: Daily Nasdaq Composite (bottom chart), Price and Relative Strength Index (top chart). Blue trend lines (A, B, and C) on the price and RSI charts show that RSI can be a leading indicator. The ability of an oscillator to trend in the opposite direction of price trend is called divergence and is therefore a leading indicator. A frequent problem with RSI is seen when you examine the underlying RSI peak and valley behavior of trend A. The problem is that while the blue trend line goes from an RSI peak in January to a lower peak in March, the RSI peaks underneath are rising. By the time you are convinced the second RSI peak in late March has formed, which is lower than the one in January, prices are already headed down and you don’t need an indicator to tell you. The counterargument that the January RSI peak is so much higher than any other local RSI peak only serves to make you use RSI for major tops or bottoms. Then you will look at RSI at the beginning of 1999 and have to say that you are not sure how high RSI needs to be to serve as an RSI top and the start of a divergence because there certainly was no divergence with prices in 1999. |
| Graphic provided by: MetaStock. |
| Graphic provided by: Data Vendor: eSignal. |
| |
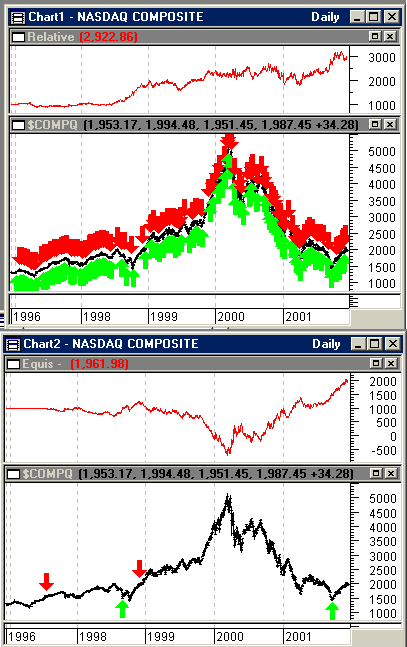
 Figure 2: Equity performance ($1,000 investment) and Daily Nasdaq Composite price data using two trading systems. The top two charts used an RSI crossover system, while the bottom two charts used a standard RSI threshold crossing system. Even if the thresholds are changed the equity performance does not improve. For example using RSI values of 65 and 35, versus 70 and 30 to enter and exit longs and shorts, only increases your number of trades and reduces profit. I then compared this RSI crossover system against the typical approach of using 70 and 30 as crossover thresholds and optimizing on periods. For the crossover of RSIs, the MetaStock formula I used was: Long Entry adjust:=Abs((RSI(14)-RSI(21))/(RSI(14)+RSI(21))); RSI(opt2)-opt1*(adjust) > RSI(opt3), And Short entry, adjust:=Abs((RSI(14)-RSI(21))/(RSI(14)+RSI(21))); RSI(opt2)+opt1*(adjust) The standard approach for using thresholds for long entry is Cross( RSI(opt1), 30 ), long exit is Cross( 70, RSI(opt1)), for short entry is Cross( 70, RSI(opt1)), and for short exit is Cross( RSI(opt1), 30 ). Which is to say enter long when RSI (period optimized) is greater than 30, exit long when RSI (period optimized) is less than 70, and just the opposite for shorts. You can see that in the MetaStock formula for crossover of RSIs that I let the system optimize on period, like the system using the crossing of 70 and 30 thresholds. I initially found that a seven and 14-day RSI crossover system did better than using RSI thresholds, and so I wanted to see just how good it could get and let a system test optimize on the use of periods for crossover of RSIs. I also changed 70 and 30 as the threshold crossing and it did worse, so the best appears to be using thresholds of 70 and 30. I did get some improvement. Looking at the number of trades for the crossover of RSI's system (Figure 2: top two charts) versus the crossing of RSI thresholds system (Figure 2: bottom two charts), it is almost a joke to use the thresholds systems. But then the crossover of the RSI's system is vulnerable to whipsaws. Better, but not necessarily anything to write home about. Until I see something different, using RSI 70 and 30 thresholds, in my view, is simply an interesting exercise. It then occurred to me that using the crossing RSI strategy was just an artifice for what my eye was really seeing. I liked what a seven-day RSI was doing, but it was noisy. What I really saw were major peaks and valleys in RSI, along with minor ones. I wanted to find out if I could trade the changes in RSI as peaks and valleys were formed. As a practical matter, the easiest way to do this is to employ the ZigZag function. However since ZigZag always connects the correct peaks and valleys by virtue of having all the data, you can fool yourself about the performance of the system. My initial try using ZigZag percentage made an unbelievable $50,000 versus the $2,000 from RSI crossings system. I kept putting on restrictions until I could finally get a chart that I could read and make the same buy and sell decisions. In fact you might argue it's overly restrictive, but the system still does ok. |
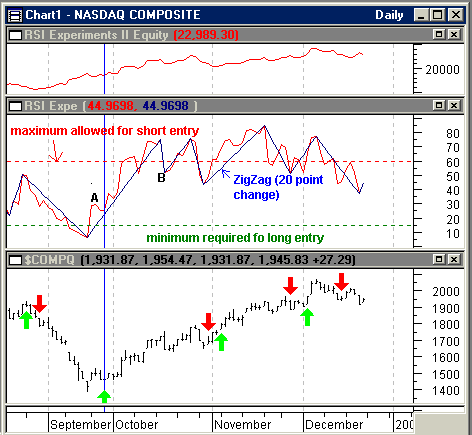
 Figure 3: Daily Nasdaq Composite price data (bottom chart), seven-day RSI (middle chart), equity performance (top chart: $1,000 invested in January of 1996). Green up-arrows are long entries and red down-arrows are short entries. While the trading system is using a ZigZag (20 point change) of RSI (seven periods), the buy and sell rules have been implemented in a way that should allow you to just use RSI and not rely on ZigZag's perfect hindsight. The trading rules are: (1) A valid peak or valley requires at least a 20 point change in RSI(7). (2) For long entry, require that RSI(7) be above 15 (dashed green line in Figure 3) and short entry below 60 (dashed red line in Figure 3). (3) Require that there be three successive days of increasing RSI for long entry and three successive days of decreasing RSI for short entry. For exit on longs, three days of decreasing RSI and for shorts, three days of increasing RSI. This also helps assure that there is a peak or valley. (4) To avoid whipsaws require at least a 15 point change in RSI between the highest high and lowest low for the last 14 days. For long entry require that the highest high is 15 points greater than the lowest low. For short entry require that the lowest low is less than 15 points below the highest high. Close a long position only if the lowest low is 15 points below the highest high. Close a short position only if the lowest low is greater than 15 points below the highest high. At point A, Figure 3 middle chart, RSI(7) has defined a valley by virtue of three successive increases and being greater than a 20 point change. Point A is also an entry because it is above the minimum and it is not just noise because it is higher than lowest low seen in the last 14 days by at least 15 points. Point B fails to trigger a short entry because it does not pass the noise test of being below the lowest low that is 15 points below the highest high for the last 14 days. At the end of October all of the conditions for short are met. This is a mistake but the system reverses itself and starts to make money again. The MetaStock formulas are below. Opt1, opt2, opt3, and opt4 are 15, 60, 10 and 10 respectively. The annual percentage gain is 437.39% versus buy and hold of 10.22% starting in 1996. With $1,000 invested the current equity is $21,999.30. There were 69 winning trades and 50 losing trades. The average win was $447.77 and the average loss $178.07. The biggest loss was $1738.12, while the biggest win $3118.08, and the average win to average loss ratio was 2.51. I have added comments in {}'s so you can see what long entry is doing and then the rest follow the same technique: Long entry: cond1:=Zig(RSI(7),20,points) > opt1; {require that a seven period RSI having a 20 point change is greater than the minimum amount which is 15} cond2:=Zig(RSI(7),20,points) > Ref(Zig(RSI(7),20,points),-1); {set up the condition for entry that requires today's change in RSI (7) be greater than yesterdays} cond3:=Ref(Zig(RSI(7),20,points),-1) > Ref(Zig(RSI(7),20,points),-2); {set up the condition for entry that requires yesterday's change in RSI (7) be greater than the day before yesterday} cond4:=Ref(Zig(RSI(7),20,points),-2) > Ref(Zig(RSI(7),20,points),-3); {set up the condition for entry that requires the day before yesterday's change in RSI (7) be greater than two days back} cond5:=HHV(RSI(7),14) > LLV(RSI(7),14)+15; {set up the condition that for entry that looking back over the last 14 days of RSI(7) require that the highest value of RSI(7) be at least 15 points greater than the lowest low - avoid entering if RSI(7) is just bouncing around and hasn't made a "significant" move -that is noise} cond1 AND cond2 AND cond3 AND cond4 AND cond5 {enter a long position only if all of the above is true} Long exit: cond1:=Zig(RSI(7),20,points) < opt3; cond2:=Zig(RSI(7),20,points) < Ref(Zig(RSI(7),20,points),-1); cond3:=Ref(Zig(RSI(7),20,points),-1) < Ref(Zig(RSI(7),20,points),-2); cond4:=Ref(Zig(RSI(7),20,points),-2) < Ref(Zig(RSI(7),20,points),-3); cond5:=LLV(RSI(7),14) < HHV(RSI(7),14)-15; cond1 AND cond2 AND cond3 AND cond4 AND cond5 Short entry: cond1:=Zig(RSI(7),20,points) < opt2; cond2:=Zig(RSI(7),20,points) < Ref(Zig(RSI(7),20,points),-1); cond3:=Ref(Zig(RSI(7),20,points),-1) < Ref(Zig(RSI(7),20,points),-2); cond4:=Ref(Zig(RSI(7),20,points),-2) < Ref(Zig(RSI(7),20,points),-3); cond5:=LLV(RSI(7),14) < HHV(RSI(7),14)-15; cond1 AND cond2 AND cond3 AND cond4 AND cond5 Short exit: cond1:=Zig(RSI(7),20,points) > opt4; cond2:=Zig(RSI(7),20,points) > Ref(Zig(RSI(7),20,points),-1); cond3:=Ref(Zig(RSI(7),20,points),-1) > Ref(Zig(RSI(7),20,points),-2); cond4:=Ref(Zig(RSI(7),20,points),-2) > Ref(Zig(RSI(7),20,points),-3); cond5:=LLV(RSI(7),14)>HHV(RSI(7),14)-15; cond1 AND cond2 AND cond3 AND cond4 AND cond5 |
Market index trading on a daily basis.
| Title: | Staff Writer |
| Company: | Technical Analysis, Inc. |
| Address: | 4757 California Ave SW |
| Seattle, WA 98116-4499 | |
| Phone # for sales: | 206 938 0570 |
| Fax: | 206 938 1307 |
| Website: | www.traders.com |
| E-mail address: | dpeterson@traders.com |
Traders' Resource Links | |
| Charting the Stock Market: The Wyckoff Method -- Books | |
| Working-Money.com -- Online Trading Services | |
| Traders.com Advantage -- Online Trading Services | |
| Technical Analysis of Stocks & Commodities -- Publications and Newsletters | |
| Working Money, at Working-Money.com -- Publications and Newsletters | |
| Traders.com Advantage -- Publications and Newsletters | |
| Professional Traders Starter Kit -- Software | |
Click here for more information about our publications!
Comments
Date: 01/08/02Rank: 4Comment: Would also like to see easylanguage
Date: 01/08/02Rank: 5Comment: thanks very useful, worth exploring
Date: 01/08/02Rank: 5Comment:
Date: 01/15/02Rank: 5Comment: It s about time for a very usefull article
Date: 08/09/03Rank: 5Comment:

|

Request Information From Our Sponsors
- StockCharts.com, Inc.
- Candle Patterns
- Candlestick Charting Explained
- Intermarket Technical Analysis
- John Murphy on Chart Analysis
- John Murphy's Chart Pattern Recognition
- John Murphy's Market Message
- MurphyExplainsMarketAnalysis-Intermarket Analysis
- MurphyExplainsMarketAnalysis-Visual Analysis
- StockCharts.com
- Technical Analysis of the Financial Markets
- The Visual Investor
- VectorVest, Inc.
- Executive Premier Workshop
- One-Day Options Course
- OptionsPro
- Retirement Income Workshop
- Sure-Fire Trading Systems (VectorVest, Inc.)
- Trading as a Business Workshop
- VectorVest 7 EOD
- VectorVest 7 RealTime/IntraDay
- VectorVest AutoTester
- VectorVest Educational Services
- VectorVest OnLine
- VectorVest Options Analyzer
- VectorVest ProGraphics v6.0
- VectorVest ProTrader 7
- VectorVest RealTime Derby Tool
- VectorVest Simulator
- VectorVest Variator
- VectorVest Watchdog
