HOT TOPICS LIST
- MACD
- Fibonacci
- RSI
- Gann
- ADXR
- Stochastics
- Volume
- Triangles
- Futures
- Cycles
- Volatility
- ZIGZAG
- MESA
- Retracement
- Aroon
INDICATORS LIST
LIST OF TOPICS
PRINT THIS ARTICLE
by Chaitali Mohile
TEVA Pharmaceutical is consolidating near its immediate support.
Position: N/A
Chaitali Mohile
Active trader in the Indian stock markets since 2003 and a full-time writer. Trading is largely based upon technical analysis.
PRINT THIS ARTICLE
SUPPORT & RESISTANCE
TEVA At Support-Resistance Zone
05/07/10 01:03:02 PMby Chaitali Mohile
TEVA Pharmaceutical is consolidating near its immediate support.
Position: N/A
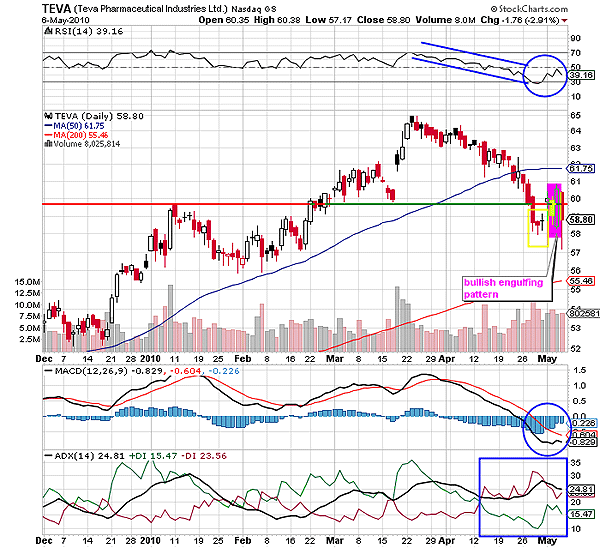
| The uptrend for Teva Pharmaceutical (TEVA) has been volatile. The trend changed its direction frequently, disturbing the stability of the price rally. The stock rallied from 54 to 65 in a time span of four months. The support-resistance at 60 levels was retested even after the breakout in Figure 1. Due to the high volatility in the rally, TEVA failed to sustain at the near 65 levels. The relative strength index (RSI) (14) as well as the average directional movement index (ADX) (14) were rallying in bullish areas. But the upward movement paused and both the oscillators reversed direction. As the price rallied to a lower low, the ADX (14) simultaneously developed an intermediate downtrend for TEVA. |

|
| FIGURE 1: TEVA, DAILY. The stock got stuck in the support-resistance zone at 60 levels. |
| Graphic provided by: StockCharts.com. |
| |
| The descending rally is back to the previous support-resistance zone at 60 levels. TEVA has been consolidating in this zone over the past few days. During the sideways action, the stock formed a small hammer and doji; see the yellow box in Figure 1. The hammer candlestick pattern signifies the current downtrend getting hammered and the initiation of a fresh uptrend. These two candlesticks were followed by a bullish engulfing pattern (purple block) in Figure 1. The bullish engulfing pattern is a bullish trend reversal candlestick. Although both the candlesticks (hammer and bullish engulfing) have appeared on the daily time frame, TEVA is reluctant to initiate a fresh uptrend. The ADX (14) at 24 levels is suggesting the developing downtrend, the RSI (14) is not reflecting a new upward rally, and the moving average convergence/divergence (MACD) (12,26,9) is negative. |
| Therefore, the stock is likely to consolidate near this support-resistance area. The consolidation would form a bearish flag & pennant formation for TEVA. This is likely to weaken the stock further. To regain the bullish sentiments, TEVA has to breach the resistance at 60 levels as well as the 50-day moving average (MA). However, gaining those bullish sentiments in the current market environment seems to be a challenge. |
Active trader in the Indian stock markets since 2003 and a full-time writer. Trading is largely based upon technical analysis.
| Company: | Independent |
| Address: | C1/3 Parth Indraprasth Towers. Vastrapur |
| Ahmedabad, Guj 380015 | |
| E-mail address: | chaitalimohile@yahoo.co.in |
Traders' Resource Links | |
| Independent has not added any product or service information to TRADERS' RESOURCE. | |
Click here for more information about our publications!
PRINT THIS ARTICLE

Request Information From Our Sponsors
- StockCharts.com, Inc.
- Candle Patterns
- Candlestick Charting Explained
- Intermarket Technical Analysis
- John Murphy on Chart Analysis
- John Murphy's Chart Pattern Recognition
- John Murphy's Market Message
- MurphyExplainsMarketAnalysis-Intermarket Analysis
- MurphyExplainsMarketAnalysis-Visual Analysis
- StockCharts.com
- Technical Analysis of the Financial Markets
- The Visual Investor
- VectorVest, Inc.
- Executive Premier Workshop
- One-Day Options Course
- OptionsPro
- Retirement Income Workshop
- Sure-Fire Trading Systems (VectorVest, Inc.)
- Trading as a Business Workshop
- VectorVest 7 EOD
- VectorVest 7 RealTime/IntraDay
- VectorVest AutoTester
- VectorVest Educational Services
- VectorVest OnLine
- VectorVest Options Analyzer
- VectorVest ProGraphics v6.0
- VectorVest ProTrader 7
- VectorVest RealTime Derby Tool
- VectorVest Simulator
- VectorVest Variator
- VectorVest Watchdog
