HOT TOPICS LIST
- MACD
- Fibonacci
- RSI
- Gann
- ADXR
- Stochastics
- Volume
- Triangles
- Futures
- Cycles
- Volatility
- ZIGZAG
- MESA
- Retracement
- Aroon
INDICATORS LIST
LIST OF TOPICS
PRINT THIS ARTICLE
by Chaitali Mohile
The negative rally has pulled BP Amoco below the various support areas.
Position: Buy
Chaitali Mohile
Active trader in the Indian stock markets since 2003 and a full-time writer. Trading is largely based upon technical analysis.
PRINT THIS ARTICLE
CHART ANALYSIS
BP Plunges To Support
05/06/10 02:24:05 PMby Chaitali Mohile
The negative rally has pulled BP Amoco below the various support areas.
Position: Buy
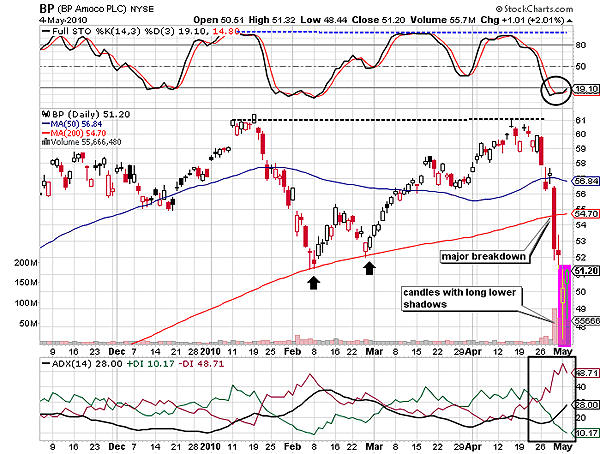
| The two black arrows in Figure 1 of BP Amoco (BP) show robust support offered by the 200-day moving average (MA). The bullish rally initiated from this support level hit the resistance at 61 levels. In addition to the negative new release, the company was faced with a weak average directional movement index (ADX) (14) and the full stochastic (14,3,3) in an overbought region; the rally was depressed. We can see that the stock formed a doji near the resistance levels (see the dotted line). BP formed a double-top, a bearish reversal formation, suggesting a potential bearish breakout. As a result, BP breached all major supports and plunged to the 47 levels. The corrective rally developed a fresh bear trend and the relative strength index (RSI)(14) dropped to the oversold region. |

|
| FIGURE 1: BP, DAILY |
| Graphic provided by: StockCharts.com. |
| |
| From a technical standpoint, BP has sprung from the low. However, the future of the stock price lies in how the company handles its recent ecological disaster. Leaving that aside, let's take a look at its stock chart. The long lower shadow of the recent candle appeared because BP closed much above the intraday low. Since the price has moved below the 200-day MA support, the ADX (14) is indicating a developing downtrend. The stochastic oscillator is in oversold territory below 20 levels. If a more positive fundamental outlook emerges, you could find fresh buying opportunities with an initial target at the 200-day MA resistance. |

|
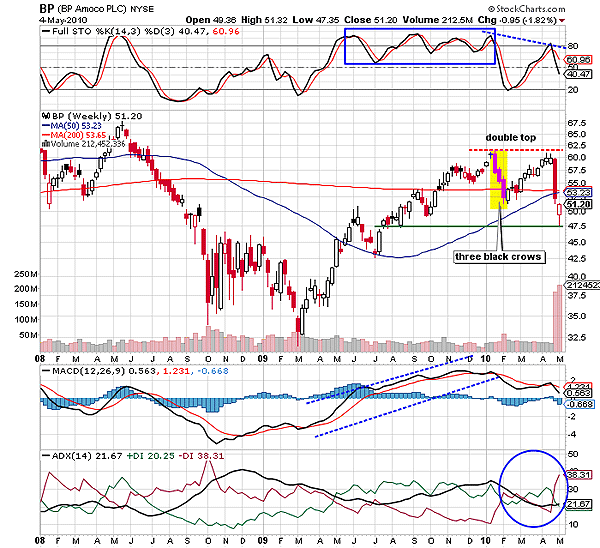
| FIGURE 2: BP, WEEKLY |
| Graphic provided by: StockCharts.com. |
| |
| Let's take a look at how negative the indicators look after BP's recent woes. In January 2010, the first peak was made at 61. After that, BP plunged below the 200-day MA support. The three black crows pattern — a bearish reversal candlestick pattern — initiated the short-term corrective rally on the weekly time frame in Figure 2. The pullback rally immediately established support at the long-term MA and soon hit the previous high. However, the volatile stochastic oscillator could not reach the prior high and developed a negative divergence for BP. The declining ADX (14) also failed to surge in the developing uptrend region above 20 levels. In fact, the increased selling pressure boosted the bears' hold on the trend. The high selling pressure could drag down the price levels of BP. The bearish breakout of the double-top formation showed its effect by price retracing toward the previous low at 47.5 levels. The stock has turned weaker as the price has drifted below both the MAs. |
| Will the stock be able to sustain support at 47.5 levels, or will it slide down the slippery slope? |
Active trader in the Indian stock markets since 2003 and a full-time writer. Trading is largely based upon technical analysis.
| Company: | Independent |
| Address: | C1/3 Parth Indraprasth Towers. Vastrapur |
| Ahmedabad, Guj 380015 | |
| E-mail address: | chaitalimohile@yahoo.co.in |
Traders' Resource Links | |
| Independent has not added any product or service information to TRADERS' RESOURCE. | |
Click here for more information about our publications!
PRINT THIS ARTICLE

Request Information From Our Sponsors
- StockCharts.com, Inc.
- Candle Patterns
- Candlestick Charting Explained
- Intermarket Technical Analysis
- John Murphy on Chart Analysis
- John Murphy's Chart Pattern Recognition
- John Murphy's Market Message
- MurphyExplainsMarketAnalysis-Intermarket Analysis
- MurphyExplainsMarketAnalysis-Visual Analysis
- StockCharts.com
- Technical Analysis of the Financial Markets
- The Visual Investor
- VectorVest, Inc.
- Executive Premier Workshop
- One-Day Options Course
- OptionsPro
- Retirement Income Workshop
- Sure-Fire Trading Systems (VectorVest, Inc.)
- Trading as a Business Workshop
- VectorVest 7 EOD
- VectorVest 7 RealTime/IntraDay
- VectorVest AutoTester
- VectorVest Educational Services
- VectorVest OnLine
- VectorVest Options Analyzer
- VectorVest ProGraphics v6.0
- VectorVest ProTrader 7
- VectorVest RealTime Derby Tool
- VectorVest Simulator
- VectorVest Variator
- VectorVest Watchdog
