HOT TOPICS LIST
- MACD
- Fibonacci
- RSI
- Gann
- ADXR
- Stochastics
- Volume
- Triangles
- Futures
- Cycles
- Volatility
- ZIGZAG
- MESA
- Retracement
- Aroon
INDICATORS LIST
LIST OF TOPICS
PRINT THIS ARTICLE
by Chaitali Mohile
Is MANH undergoing a simple gap-filling process or a trend reversal rally?
Position: N/A
Chaitali Mohile
Active trader in the Indian stock markets since 2003 and a full-time writer. Trading is largely based upon technical analysis.
PRINT THIS ARTICLE
GAPS
Manhattan Associates Filling Up The Gap
05/05/10 02:10:55 PMby Chaitali Mohile
Is MANH undergoing a simple gap-filling process or a trend reversal rally?
Position: N/A
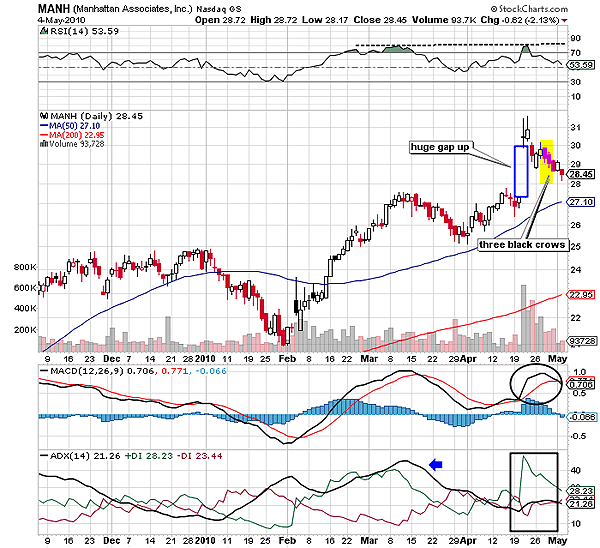
| Recently, there was a huge gap up on the daily chart of Manhattan Associates (MANH). The stock breached an intermediate resistance at $27 formed by the previous bearish consolidation range. The uptrend was overheated as indicated by the overbought relative strength index (RSI). Notice that MANH retraced to its 50-day moving average (MA) support in March 2010. Thereafter, the descending average directional movement index (ADX) (14) failed to develop either of the trends, thus inducing high volatility in the upcoming rally. We can see in Figure 1 that though the price rally was initiated with the 50-day MA support, the volume was lethargic. As a result, MANH struggled to breach resistance at $27. The huge gap up in April helped to break out of the resistance zone. After the gap up, the stock jumped to $31. Generally, gaps occur on some news for the particular stocks and cannot be anticipated. |

|
| FIGURE 1: MANH, DAILY |
| Graphic provided by: StockCharts.com. |
| |
| At $31, MANH formed a perfect doji followed by a bullish candle with a long upper shadow and a small lower shadow. The real body of the second candle is almost equal to the upper shadow; therefore, we cannot consider it a shooting star candlestick pattern. However, the candles together generated uncertainty and fear among the traders, as can be seen by the volume. In addition, the ADX (14) failed to surge above 20 levels, though the buying pressure increased rapidly. The RSI (14) seemed reluctant to cross the resistance at 80 levels, and the moving average convergence/divergence (MACD) (12,26,9) that sharply turned positive descended while in positive territory. During the process, the stock witnessed three sharp bearish sessions, opening within the body of the previous day and ending at new intraday lows. This brought about the three black crows, a bearish reversal candlestick pattern, on the daily time frame in Figure 1. |
| So is the downward rally merely a gap-filling action or a serious correction? For me, the current rally is just covering the previous gap as long as MANH sustains above the 50-day MA support. Although the three black crows must have unnerved the bulls on the street, the stock has robust MA action, and the RSI (14) is also above 50 levels. In such situations, we have to just wait and watch the price movement and trigger the button at right time. The ongoing rally is likely to establish support at the 50-day MA without damaging the main trend. |

|
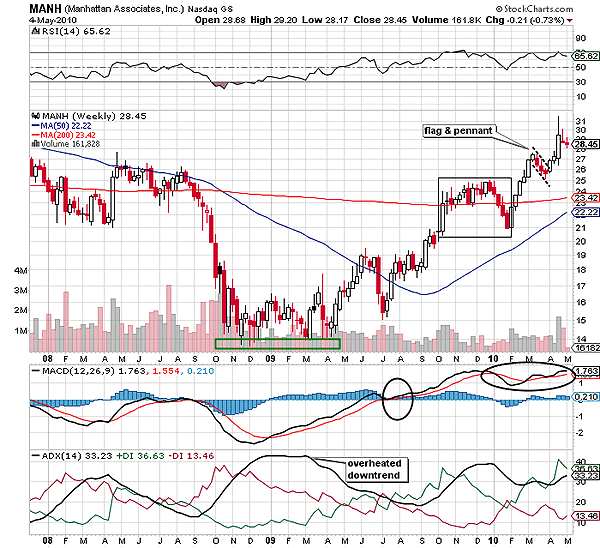
| FIGURE 2: MANH, WEEKLY |
| Graphic provided by: StockCharts.com. |
| |
| MANH formed a strong bottom at 16 levels to initiate a pullback rally in 2009. The rally gradually moved above the 50-day and 200-day MA resistance in Figure 2. The RSI (14), the MACD (12,26,9), and the ADX (14) surged in the bullish areas from extreme bearish conditions. The indicators' upward movements encouraged the price action to continue its bullish journey. During the rally, the newly formed 200-day support and the previous low at 21 levels was challenged in late 2009 and early 2010. After retesting the supports, MANH hit the previous high resistance at 27 levels and underwent consolidation. The declining sideways action formed a short-term bullish flag & pennant continuation pattern. The ADX (14) reflected a well-developed uptrend confirming the bullish breakout of the continuation pattern. The breakout carried MANH to the new high at $31 with healthy volume. We can see small bearish doji candles in Figure 2; however, long traders need to worry about them, as the stock has many strong supports and bullish indicators. Meanwhile, the volatility reflected by the MACD (12,26,9) would get diluted by the other two oscillators. |
| Thus, MANH could establish support at $27 and open a fresh buy setup for traders. The big picture also confirms the current bearish rally as a gap-filling process and not a trend reversal. |
Active trader in the Indian stock markets since 2003 and a full-time writer. Trading is largely based upon technical analysis.
| Company: | Independent |
| Address: | C1/3 Parth Indraprasth Towers. Vastrapur |
| Ahmedabad, Guj 380015 | |
| E-mail address: | chaitalimohile@yahoo.co.in |
Traders' Resource Links | |
| Independent has not added any product or service information to TRADERS' RESOURCE. | |
Click here for more information about our publications!
PRINT THIS ARTICLE

Request Information From Our Sponsors
- StockCharts.com, Inc.
- Candle Patterns
- Candlestick Charting Explained
- Intermarket Technical Analysis
- John Murphy on Chart Analysis
- John Murphy's Chart Pattern Recognition
- John Murphy's Market Message
- MurphyExplainsMarketAnalysis-Intermarket Analysis
- MurphyExplainsMarketAnalysis-Visual Analysis
- StockCharts.com
- Technical Analysis of the Financial Markets
- The Visual Investor
- VectorVest, Inc.
- Executive Premier Workshop
- One-Day Options Course
- OptionsPro
- Retirement Income Workshop
- Sure-Fire Trading Systems (VectorVest, Inc.)
- Trading as a Business Workshop
- VectorVest 7 EOD
- VectorVest 7 RealTime/IntraDay
- VectorVest AutoTester
- VectorVest Educational Services
- VectorVest OnLine
- VectorVest Options Analyzer
- VectorVest ProGraphics v6.0
- VectorVest ProTrader 7
- VectorVest RealTime Derby Tool
- VectorVest Simulator
- VectorVest Variator
- VectorVest Watchdog
