HOT TOPICS LIST
- MACD
- Fibonacci
- RSI
- Gann
- ADXR
- Stochastics
- Volume
- Triangles
- Futures
- Cycles
- Volatility
- ZIGZAG
- MESA
- Retracement
- Aroon
INDICATORS LIST
LIST OF TOPICS
PRINT THIS ARTICLE
by Donald W. Pendergast, Jr.
With daily and weekly cycle tops already established, technicians and traders now seek how best to project possible support areas in the NASDAQ 100.
Position: N/A
Donald W. Pendergast, Jr.
Donald W. Pendergast is a financial markets consultant who offers specialized services to stock brokers and high net worth individuals who seek a better bottom line for their portfolios.
PRINT THIS ARTICLE
SUPPORT & RESISTANCE
NASDAQ 100 More Downside?
05/05/10 08:47:50 AMby Donald W. Pendergast, Jr.
With daily and weekly cycle tops already established, technicians and traders now seek how best to project possible support areas in the NASDAQ 100.
Position: N/A
| Well, it was a nice run while it lasted, eh? But like most bull phases in the markets, when the reversal finally arrives, it usually does so with an unmistakable bang. Here's a brief look at the NASDAQ 100 (NDX), one that paints a convincing image of a major stock index that is likely to continue to fall for at least the next few weeks, at least until the anticipated weekly cycle lows start to kick in by the end of May or early june 2010. See Figure 1. |

|
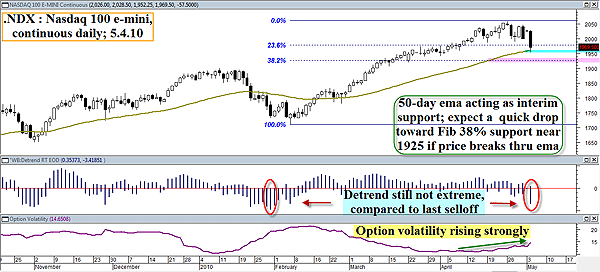
| FIGURE 1: NDX, DAILY. If this is a real trend reversal, expect the 50-day EMA to give way sooner rather than later. A break below the EMA suggests a rather quick rundown toward 1925, the Fibonacci 38.2% support for the massive February to April 2010 price runup. |
| Graphic provided by: MetaStock. |
| Graphic provided by: WB Detrend RT EOD from ProfitTrader for MetaStock. |
| |
| With the NDX already having blasted south of the 23.4% Fibonacci retracement level, the venerable 50-day exponential moving average (EMA) (gold line on chart) has stepped up to the plate, successfully bringing at least a temporary halt to the Nasdaq 100's current slide. Anyone who's watched enough chart action over the years may already be familiar with the uncanny ability of this EMA (and its cousin, the 50-period simple moving average) to act as key support/resistance both in strong up/downtrends as well as in reversal situations like this one. The main difference is this, however. In a confirmed up/downtrend, the 50-EMA will frequently act as a spring board and prices will often continue to trend. But during major trend reversals (as this may turn out to be, no one really knows at this point), the 50-day EMA may only act as a temporary support & resistance barrier, after which prices simply wave farewell to it and continue lower (higher) seeking more formidable, enduring S&R levels that may be offered by multiple Fibonacci confluence/extension levels, extreme Keltner band levels, and/or significant prior highs and lows. And, of course, after this initial violation of the 50-day EMA during the trend reversal, then the 50-day EMA will assume the role of support/resistance in the direction of the newly established trend direction. Got that? Sounds confusing at first, but as you work with this vital moving average on your charts, you'll understand how useful it really is during reversals and trend continuation phases. Also on this chart, note the two red ovals highlighting the most recent detrend oscillator action during sharp selloffs; although it's getting down there, it still has some room to run before it reaches the extremes posted in February 2010. If you see the 50-day EMA give way, monitor the detrend readings as price hits the 38.2% Fibonacci support area near 1925; if it still is not as far down as that seen in February, use caution, as that might mean that there is still some more downside left before a solid daily cycle low can be made. Note also that the option market volatility for this index is steadily rising (bottom plot on chart), consistent with a heavy selloff. |

|
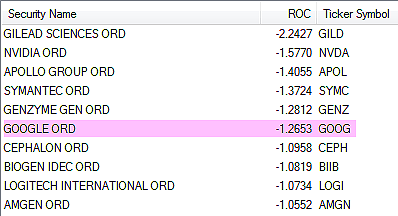
| FIGURE 2: NASDAQ 100 WEAKEST. The 10 weakest NASDAQ 100 component stocks, based on a simple 13-week rate of change (ROC) calculation against the .NDX. Google call sellers may be afforded with a low-risk sale of the May 570 call. |
| Graphic provided by: MetaStock. |
| |
| Figure 2 are the 10 weakest stocks in the NDX, based on a 13-week rate of change calculation against the index; GILD remains very weak, and even the mighty Google (GOOG) has begun to plunge sharply, shedding more than $20 a share just in today's session. All of these stocks could be excellent candidates to sell short-term out-of-the-money calls against, especially now that implied volatility levels are getting nice and juicy again (just like they do on every selloff). For example, as of today's close you could sell a May 2010 GOOG $570 call for about $1.00. There are only 16 days left until option expiration, meaning that GOOG will have to tack on nearly $65 in gains in order for this far out-of-the-money call to go into the money. And with the selloff in the NDX, its parent index, likely to continue for the foreseeable future, this could be a great way to bring in some extra cash into your margin account. The big idea here is to make sure you buy back the short call if it looks as if it might double in price before expiration (it could happen, but it ain't likely). With the option shedding large amounts of time value every day (currently at $14 per day per contract, not a misprint), unless there is a sudden short squeeze in GOOG shares, most likely the only thing you'll need to do on this option trade is to: 1. Sell the May 570 call 2. Wait till expiration 3. Keep all the dough 4. Be thankful for your blessings 5. Wait for another low-risk option sale play. And you can be sure of this, that as long as there are major market reversals, there will always be an ample supply of overvalued call and put options to sell against stocks that have found a new direction to travel in. These are some of the lowest-risk, most enjoyable trade opportunities available, as many experienced option traders already know. Try this trade on your own and see if it isn't a better way for you to trade — you might be surprised at how easy it can be. See Figure 3. |

|
| FIGURE 3: GOOG. Theta simply means how much time value the option will lose every day; currently, the May 570 GOOG call (which is nearly 12% out-of-the-money) will lose about $14 in time value by the end of the next trading session. Selling short-term far OTM calls on falling stocks can be a very profitable pastime for skilled traders. |
| Graphic provided by: Thinkorswim. |
| |
Donald W. Pendergast is a financial markets consultant who offers specialized services to stock brokers and high net worth individuals who seek a better bottom line for their portfolios.
| Title: | Writer, market consultant |
| Company: | Linear Trading Systems LLC |
| Jacksonville, FL 32217 | |
| Phone # for sales: | 904-239-9564 |
| E-mail address: | lineartradingsys@gmail.com |
Traders' Resource Links | |
| Linear Trading Systems LLC has not added any product or service information to TRADERS' RESOURCE. | |
Click here for more information about our publications!
PRINT THIS ARTICLE

Request Information From Our Sponsors
- StockCharts.com, Inc.
- Candle Patterns
- Candlestick Charting Explained
- Intermarket Technical Analysis
- John Murphy on Chart Analysis
- John Murphy's Chart Pattern Recognition
- John Murphy's Market Message
- MurphyExplainsMarketAnalysis-Intermarket Analysis
- MurphyExplainsMarketAnalysis-Visual Analysis
- StockCharts.com
- Technical Analysis of the Financial Markets
- The Visual Investor
- VectorVest, Inc.
- Executive Premier Workshop
- One-Day Options Course
- OptionsPro
- Retirement Income Workshop
- Sure-Fire Trading Systems (VectorVest, Inc.)
- Trading as a Business Workshop
- VectorVest 7 EOD
- VectorVest 7 RealTime/IntraDay
- VectorVest AutoTester
- VectorVest Educational Services
- VectorVest OnLine
- VectorVest Options Analyzer
- VectorVest ProGraphics v6.0
- VectorVest ProTrader 7
- VectorVest RealTime Derby Tool
- VectorVest Simulator
- VectorVest Variator
- VectorVest Watchdog
