HOT TOPICS LIST
- MACD
- Fibonacci
- RSI
- Gann
- ADXR
- Stochastics
- Volume
- Triangles
- Futures
- Cycles
- Volatility
- ZIGZAG
- MESA
- Retracement
- Aroon
INDICATORS LIST
LIST OF TOPICS
PRINT THIS ARTICLE
by James Kupfer
The S&P 500 has taken a hit, but the trend is still up. For now, anyway.
Position: Hold
James Kupfer
Mr. Kupfer is a market professional and amateur stock market commentator. Disclosure: It is likely that Mr. Kupfer has or will enter a position in any security he writes about.
PRINT THIS ARTICLE
TREND-CHANNEL
Down But Not Out
05/05/10 08:31:02 AMby James Kupfer
The S&P 500 has taken a hit, but the trend is still up. For now, anyway.
Position: Hold
| In the last few weeks I have warned that a convergence of Fibonacci levels suggested that a significant top could be in the making. The broad market has now turned down, validating the Fibonacci levels. However, while this could be a significant market top, much more technical damage must occur before this is labeled this a long-term or even intermediate-term top of any consequence. We are now at one such test that will help determine how severe this top really is. |

|
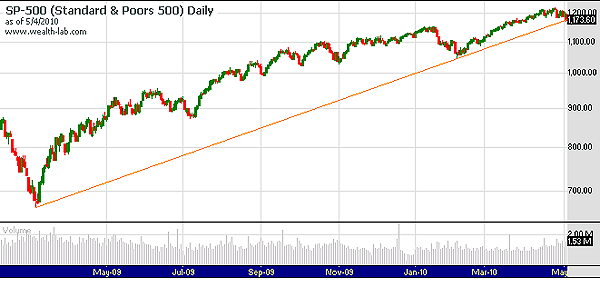
| FIGURE 1: S&P 500, DAILY. A long-term view of the S&P 500. The strength of the market is apparent and not yet over. |
| Graphic provided by: Wealth-Lab. |
| |
| Drawing a trendline from the 2009 market bottom to the February 2010 market bottom and extending it out leads to where the Standard & Poor's 500 closed on May 4, 2010. You can see the big picture in Figure 1. |
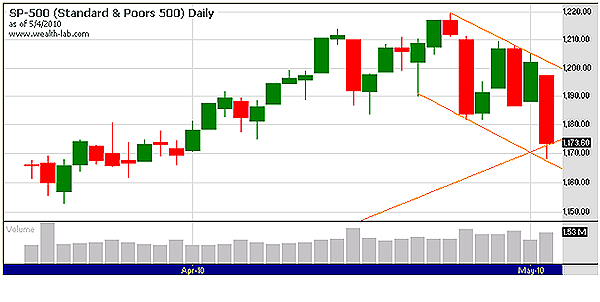
| For the rally to continue, it is imperative that the market continue to stay above this trendline. The market has not tested this line before, so technically this is not even a real trendline. However, seeing as how it is the only logical one that exists, it will be used by everyone as a "real" trendline. Note also on Figure 2 that the S&P low was within a few points of where the channel low was. |

|
| FIGURE 2: S&P 500, DAILY. A closeup view of the S&P. The market is at a short-term crossroads between the long-term uptrend and a new down channel that is forming. |
| Graphic provided by: Wealth-Lab. |
| |
| The bottom line is, there is a mixed picture right now. This would be a logical place for a long-term market top. However, the market has been on a bull run for more than a year and it is too early to say that the bear is back. There is a lot riding on the violation of the uptrend line and the channel boundaries. A close below 1160 on the S&P 500 will signal a much greater likelihood for further weakness. If the week closes greater than 1180, then the trend is still up and this top will likely not last long. |
Mr. Kupfer is a market professional and amateur stock market commentator. Disclosure: It is likely that Mr. Kupfer has or will enter a position in any security he writes about.
Click here for more information about our publications!
PRINT THIS ARTICLE

Request Information From Our Sponsors
- StockCharts.com, Inc.
- Candle Patterns
- Candlestick Charting Explained
- Intermarket Technical Analysis
- John Murphy on Chart Analysis
- John Murphy's Chart Pattern Recognition
- John Murphy's Market Message
- MurphyExplainsMarketAnalysis-Intermarket Analysis
- MurphyExplainsMarketAnalysis-Visual Analysis
- StockCharts.com
- Technical Analysis of the Financial Markets
- The Visual Investor
- VectorVest, Inc.
- Executive Premier Workshop
- One-Day Options Course
- OptionsPro
- Retirement Income Workshop
- Sure-Fire Trading Systems (VectorVest, Inc.)
- Trading as a Business Workshop
- VectorVest 7 EOD
- VectorVest 7 RealTime/IntraDay
- VectorVest AutoTester
- VectorVest Educational Services
- VectorVest OnLine
- VectorVest Options Analyzer
- VectorVest ProGraphics v6.0
- VectorVest ProTrader 7
- VectorVest RealTime Derby Tool
- VectorVest Simulator
- VectorVest Variator
- VectorVest Watchdog
