HOT TOPICS LIST
- MACD
- Fibonacci
- RSI
- Gann
- ADXR
- Stochastics
- Volume
- Triangles
- Futures
- Cycles
- Volatility
- ZIGZAG
- MESA
- Retracement
- Aroon
INDICATORS LIST
LIST OF TOPICS
PRINT THIS ARTICLE
by Ranjan Jha, CMT
The S&P 500 appears to be trending higher with the US dollar. This bodes well for US stocks.
Position: N/A
Ranjan Jha, CMT
I am a member of the Market Technicians Association and manage a limited partnership investment club in Virginia. Always seek advice from your own Financial Advisor before acting on any method outlined here since every circumstance is different.
PRINT THIS ARTICLE
CHART ANALYSIS
Intermarket Analysis Makes A Case For US Stocks
05/04/10 09:20:25 AMby Ranjan Jha, CMT
The S&P 500 appears to be trending higher with the US dollar. This bodes well for US stocks.
Position: N/A
| My Traders.com Advantage article on April 5, 2010, "Intermarket Analysis With Dollar And Bonds," made a case for a higher US dollar. Despite some bumps, the US dollar does not show any signs of weakness. Generally, a weaker dollar helps large-cap US companies export more. On top of that, they get extra boost to their bottom line due to a favorable exchange rate. Profits from abroad translate into higher dollar amounts if the dollar is weak compared to other major currencies. On the other hand, if the dollar becomes stronger than most of the large US companies that make sizable sales outside US markets, that will see their earnings adversely affected. This theme consistently played out from the beginning of the credit crisis in 2008 to the end of 2009. Since then, the trends have reversed and a strong dollar is moving along with the rising Standard & Poor's 500. Let's look at a few charts from the intermarket analysis point of view to make sense of changing trends. |
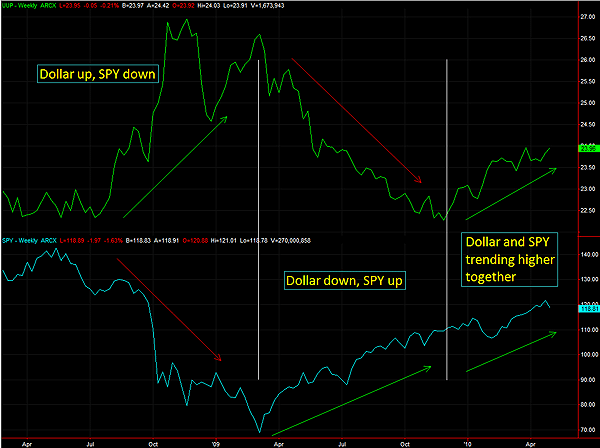
| Figure 1 shows the weekly chart of UUP (PowerShares DB US Dollar Index Bullish) versus SPY (SPDR S&P 500) exchange traded funds (ETFs) for the last two years. The US dollar had a remarkable run from the middle of 2008 to March 2009. This was the tumultuous period of the credit crisis and the dollar was considered a safe haven. Understandably, the broader US market was trending down during this period. As credit fears abated about March 2009, the dollar started trending down while SPY began its bull run. The emerging markets were still having substantial positive GDP growth so the large US companies saw improvement in their bottom line due to the falling dollar. That trend continued till the end of 2009. Since then, both the US dollar and SPY are trending higher together. |

|
| FIGURE 1: UUP & SPY ETFs, WEEKLY. Lately, the US dollar bullish ETF (UUP) has been trending higher along with SPDR S&P 500 ETF, unlike most of 2008 and 2009. |
| Graphic provided by: TradeStation. |
| |
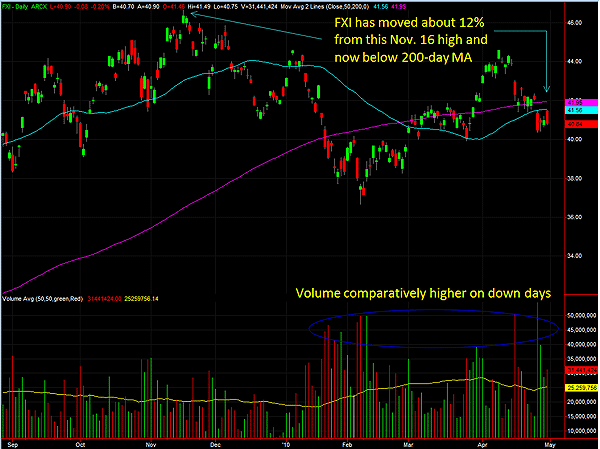
| But why has that trend reversed? The emerging markets are still expanding and their GDP growth continues to reflect that. However, chart analysis points to some trouble on the horizon. Figure 2 shows a daily chart of FXI (iShares FTSE/Xinhua China 25 ETF), representing China, the biggest component of the emerging markets. The Chinese markets fell along with the US markets during the January–February 2010 correction. Since then, however, the US indexes have hit a new high, but FXI continued to show weakness and is currently below both 50-day and 200-day moving average (MA) lines. In addition, the volume on down days for 2010 so far has been relatively higher compared to up days. This lack of performance of emerging market stocks may have prompted money moving to US stocks showing better returns. |

|
| FIGURE 2: FXI ETF, DAILY. The iShares FTSE/Xinhua China 25 ETF shows signs of weakness since the November 2009 high. |
| Graphic provided by: TradeStation. |
| |
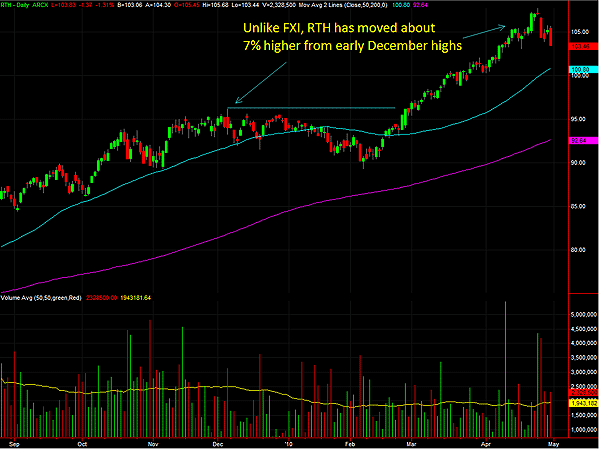
| Now, let's explore if there is any other evidence to support continuation of this trend. A quick look at RTH (retail HOLDRS ETF) in Figure 3 shows strength in the retail sector. After struggling below its December high, RTH bolted up almost in a straight line in contrast with FXI. Walmart, Home Depot, Amazon, Target, and Walgreen, constituting more than 50% of this ETF. A strong RTH indicates strength in these large-cap retailers collectively. It clearly shows that the US consumer is finally spending. There may be a near-term correction for this ETF, but both strong and uptrending 50-day and 200-day MA lines indicate strength ahead. |

|
| FIGURE 3: RTH ETF, DAILY. Retail HOLDRS ETF shows strength of the US consumers. |
| Graphic provided by: TradeStation. |
| |
| As always, nothing happens out of the blue. China is trying to cool its inflation and real estate excesses. In addition, it's facing a global pressure to appreciate its currency. It has been increasing reserve requirements for its financial institutions. These facts point to a slower growth. On the other hand, the US is seeing relatively milder inflation, increasing personal income & spending and relatively improving employment data. The US GDP has been strongly positive for two quarters in a row. Increasing consumption should help the earnings and hence US stocks. Continued turmoil in the European economy and bailout fears should drive investors to the safety of the US dollar. Technical analysis is a study of probability, and at this point in time, both fundamentals and technicals point to higher odds of US dollar and S&P 500 trending up together. We can expect US stocks to do relatively better than the emerging markets as long as these factors supporting this theory are in place. |
I am a member of the Market Technicians Association and manage a limited partnership investment club in Virginia. Always seek advice from your own Financial Advisor before acting on any method outlined here since every circumstance is different.
| Address: | 2039 Stone Mill Drive |
| Salem, VA 24153 | |
| Phone # for sales: | 540-330-2911 |
| E-mail address: | ranjanjha@hotmail.com |
Click here for more information about our publications!
Comments

Request Information From Our Sponsors
- StockCharts.com, Inc.
- Candle Patterns
- Candlestick Charting Explained
- Intermarket Technical Analysis
- John Murphy on Chart Analysis
- John Murphy's Chart Pattern Recognition
- John Murphy's Market Message
- MurphyExplainsMarketAnalysis-Intermarket Analysis
- MurphyExplainsMarketAnalysis-Visual Analysis
- StockCharts.com
- Technical Analysis of the Financial Markets
- The Visual Investor
- VectorVest, Inc.
- Executive Premier Workshop
- One-Day Options Course
- OptionsPro
- Retirement Income Workshop
- Sure-Fire Trading Systems (VectorVest, Inc.)
- Trading as a Business Workshop
- VectorVest 7 EOD
- VectorVest 7 RealTime/IntraDay
- VectorVest AutoTester
- VectorVest Educational Services
- VectorVest OnLine
- VectorVest Options Analyzer
- VectorVest ProGraphics v6.0
- VectorVest ProTrader 7
- VectorVest RealTime Derby Tool
- VectorVest Simulator
- VectorVest Variator
- VectorVest Watchdog
