HOT TOPICS LIST
- MACD
- Fibonacci
- RSI
- Gann
- ADXR
- Stochastics
- Volume
- Triangles
- Futures
- Cycles
- Volatility
- ZIGZAG
- MESA
- Retracement
- Aroon
INDICATORS LIST
LIST OF TOPICS
PRINT THIS ARTICLE
by Chaitali Mohile
Even moving closer to the historic high, the rally in CREE is unstoppable.
Position: Buy
Chaitali Mohile
Active trader in the Indian stock markets since 2003 and a full-time writer. Trading is largely based upon technical analysis.
PRINT THIS ARTICLE
CHART ANALYSIS
CREE Heading Toward Historic High
04/30/10 02:34:56 PMby Chaitali Mohile
Even moving closer to the historic high, the rally in CREE is unstoppable.
Position: Buy
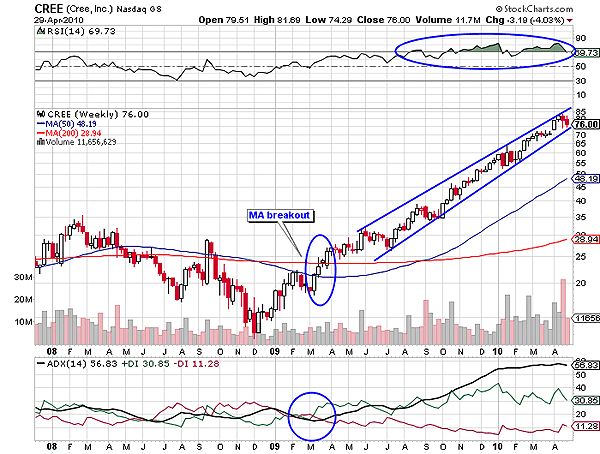
| CREE witnessed a moving average breakout in 2009. The 50- and 200-day moving average (MA) resistances was breached consecutively, generating bullish sentiments. The circle marked in Figure 1 shows the weak average directional movement index (ADX) (14) prior to the uptrend. The relative strength index (RSI) (14) also climbed into a bullish region above 50 levels, confirming incoming bullish strength in the rally and also highlighted a fresh buy setup for CREE. The rally surged vertically achieving the upper targets. Rising volume was highly supportive for the stock. Although CREE underwent a one-sided rally, the consolidation and few minor bearish sessions accumulated strength to climb higher. Thus, the journey that began at $25 reached $80 in April 2010. |

|
| FIGURE 1: CREE, WEEKLY. The stock has formed the rising wedge formation. The ADX(14) is indicating an overheated uptrend. |
| Graphic provided by: StockCharts.com. |
| |
| During the rally, the RSI (14) was highly overbought and the ADX (14) above 40 levels indicated an overheated uptrend. However, CREE consistently moved on its bullish path. We can see in Figure 1 that the stock has formed a rising wedge due to the narrowing range, but volume surged along with price. Therefore, the rising wedge as a bearish reversal pattern would be confirmed only by the two oscillators in Figure 1. The uptrend is highly overheated, but the ADX (14) does not show any indication of a trend reversal rally. Similarly, the RSI (14) has been overbought for more than six months without affecting the main rally. However, the real indicator is the price itself. Hence, a bearish breakout would occur if the price breached the lower trendline of the rising wedge. |
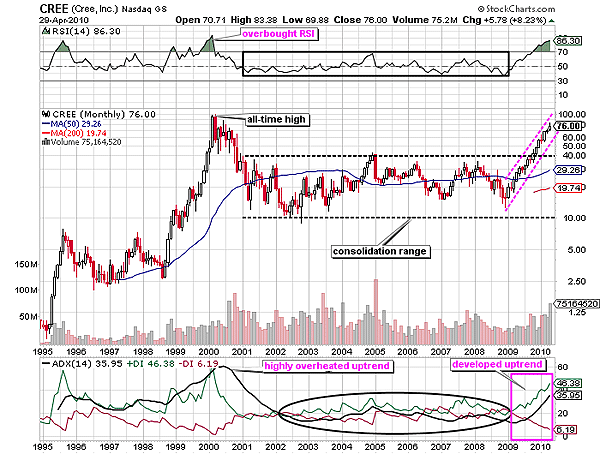
| CREE made an all-time high at $100 in 2000 (see Figure 2). The uptrend was extremely overheated and the RSI (14) was overbought. The bears dragged the stock below the 50-day MA support, pulling the stock price down to two digits, as low as $10. Thereafter, CREE underwent moderate rallies in the range of $10 and $40 for nearly nine years. Though price movement was volatile, the stable buying pressure kept the trend in the bull's favor (see large oval in Figure 2). The ADX (14) in Figure 2 calmly moved near the 20 levels with the positive directional index (+DI), rallying above the negative directional index (-DI). In addition, the RSI (14) indicated bullish strength by moving within the 50 and 70 levels. Thus, the wide range-bound action of CREE had a bullish hold. |

|
| FIGURE 2: CREE, MONTHLY. The 50-day MA breakout rally has moved closer to the historic high of 2000 at $100. |
| Graphic provided by: StockCharts.com. |
| |
| The 50-day MA bullish breakout in 2009 gradually pulled the stock above the 40 levels, initiating a fresh rally. After converting the upper range (40) resistance to support, the uptrend developed and the RSI (14) steeply crawled in an overbought zone. Thus, the breakout at 40 levels was a real trend reversal action. Thereafter, CREE violated all the barriers in the path, targeting the previous high at $100. During the rally, the candles formed are equal in size, indicating stability in CREE. Currently, the price is still $20 away from the historic high of $100. The RSI is highly overbought so it may undergo a marginal bearish move, but the oscillator may not affect the price rally much as the uptrend is well developed. |
| Thus, the target of $100 is achievable for CREE in the long run. The stock would witness a few bearish consolidations during the upward move, which should be watched as a new buying opportunity. Hence, CREE is a buy on a dip type of stock. |
Active trader in the Indian stock markets since 2003 and a full-time writer. Trading is largely based upon technical analysis.
| Company: | Independent |
| Address: | C1/3 Parth Indraprasth Towers. Vastrapur |
| Ahmedabad, Guj 380015 | |
| E-mail address: | chaitalimohile@yahoo.co.in |
Traders' Resource Links | |
| Independent has not added any product or service information to TRADERS' RESOURCE. | |
Click here for more information about our publications!
Comments
Date: 05/04/10Rank: 1Comment:

Request Information From Our Sponsors
- StockCharts.com, Inc.
- Candle Patterns
- Candlestick Charting Explained
- Intermarket Technical Analysis
- John Murphy on Chart Analysis
- John Murphy's Chart Pattern Recognition
- John Murphy's Market Message
- MurphyExplainsMarketAnalysis-Intermarket Analysis
- MurphyExplainsMarketAnalysis-Visual Analysis
- StockCharts.com
- Technical Analysis of the Financial Markets
- The Visual Investor
- VectorVest, Inc.
- Executive Premier Workshop
- One-Day Options Course
- OptionsPro
- Retirement Income Workshop
- Sure-Fire Trading Systems (VectorVest, Inc.)
- Trading as a Business Workshop
- VectorVest 7 EOD
- VectorVest 7 RealTime/IntraDay
- VectorVest AutoTester
- VectorVest Educational Services
- VectorVest OnLine
- VectorVest Options Analyzer
- VectorVest ProGraphics v6.0
- VectorVest ProTrader 7
- VectorVest RealTime Derby Tool
- VectorVest Simulator
- VectorVest Variator
- VectorVest Watchdog
