HOT TOPICS LIST
- MACD
- Fibonacci
- RSI
- Gann
- ADXR
- Stochastics
- Volume
- Triangles
- Futures
- Cycles
- Volatility
- ZIGZAG
- MESA
- Retracement
- Aroon
INDICATORS LIST
LIST OF TOPICS
PRINT THIS ARTICLE
by Koos van der Merwe
With health reform the center of controversy in the US, Orthofix is another company that could benefit.
Position: Buy
Koos van der Merwe
Has been a technical analyst since 1969, and has worked as a futures and options trader with First Financial Futures in Johannesburg, South Africa.
PRINT THIS ARTICLE
OSCILLATORS
Watch Orthofix Int'l
04/29/10 12:33:30 PMby Koos van der Merwe
With health reform the center of controversy in the US, Orthofix is another company that could benefit.
Position: Buy
| Orthofix provides surgeons and patients with innovative solutions for trauma and spine fusion. Product offerings include: -Internal systems to lengthen bone -Plating systems to reconstruct a deformity -Soft tissue management for rehabilitation -Cold therapy for post-surgical pain management In the past, spinal and bone operations would have caused patients to mortgage their houses to raise the cash needed for an operation; now, those patients will be covered. There is no doubt that more of these complicated operations will take place. Orthofix is one of those companies that will benefit because of their range of products. |

|
| FIGURE 1: OFIX, MONTHLY |
| Graphic provided by: AdvancedGET. |
| |
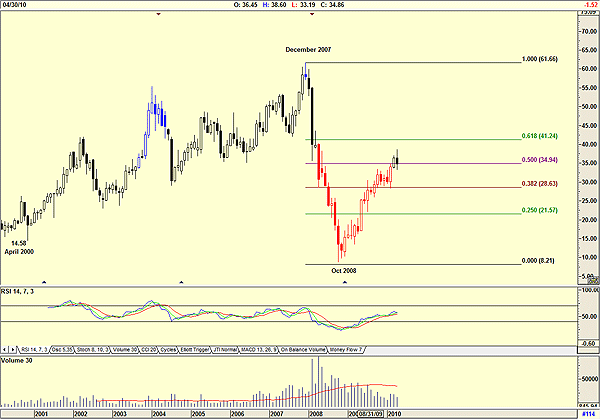
| Figure 1 is a monthly chart showing how the price started trading in April 2000 at $14.58, moved to a high of $61.66 by December 2007, and then fell to a low of $8.21 by October 2008. Since then, the price has slowly moved up to its present value of $34.86. The relative strength index (RSI) is trending upward but volume has fallen as the price rose, suggesting weakness. The Fibonacci ratio suggests that the 50% retracement level shown could be a resistance level. If not, then there is a target of $41.24 (61.8% retracement level). |

|
| FIGURE 2: OFIX, DAILY |
| Graphic provided by: AdvancedGET. |
| |
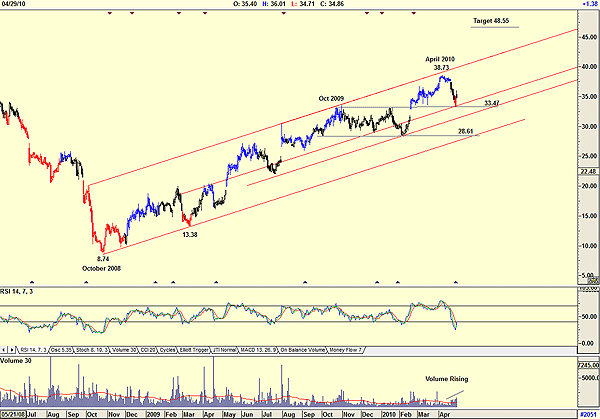
| Figure 2, a daily chart, shows how the price rose from a low of $8.74 in October 2008 to $33.47 by October 2009 when it formed a a flag pattern formation. This suggests a target of $48.55 (33.32 - 13.38 = 19.94 + 28.61 = 48.55). The RSI has given a buy signal and volume is strengthening as the price rises. Note also when the price fell, it found support at $33.47, the upper flag boundary. |

|
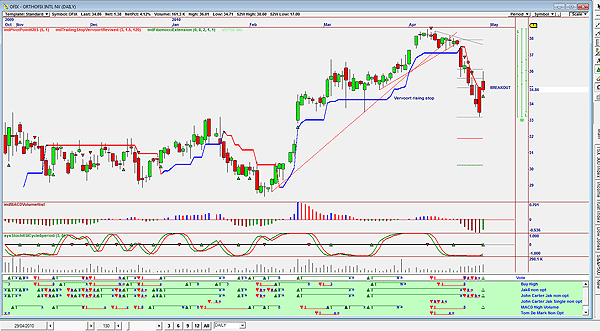
| FIGURE 3: OFIX, DAILY. Here's an OmniTrader chart showing a buy signal. |
| Graphic provided by: OmniTrader. |
| |
| Figure 3 is an OmniTrader chart that identified the share as a possible buy. In the chart I have shown the strategies that gave a buy signal on the vote line. The back test hit rate (BTHR) was 100, and the advisor rating (ADV) was 81. (My parameters are BTHR > 80 and ADV > 60.) Note as well that the price has moved above the Vervoort rising stop line, suggesting a buy. Orthofix is a share I would buy at present levels and hold for the long term with a price target of $48.55. |
Has been a technical analyst since 1969, and has worked as a futures and options trader with First Financial Futures in Johannesburg, South Africa.
| Address: | 3256 West 24th Ave |
| Vancouver, BC | |
| Phone # for sales: | 6042634214 |
| E-mail address: | petroosp@gmail.com |
Click here for more information about our publications!
Comments
Date: 05/05/10Rank: 4Comment:

Request Information From Our Sponsors
- StockCharts.com, Inc.
- Candle Patterns
- Candlestick Charting Explained
- Intermarket Technical Analysis
- John Murphy on Chart Analysis
- John Murphy's Chart Pattern Recognition
- John Murphy's Market Message
- MurphyExplainsMarketAnalysis-Intermarket Analysis
- MurphyExplainsMarketAnalysis-Visual Analysis
- StockCharts.com
- Technical Analysis of the Financial Markets
- The Visual Investor
- VectorVest, Inc.
- Executive Premier Workshop
- One-Day Options Course
- OptionsPro
- Retirement Income Workshop
- Sure-Fire Trading Systems (VectorVest, Inc.)
- Trading as a Business Workshop
- VectorVest 7 EOD
- VectorVest 7 RealTime/IntraDay
- VectorVest AutoTester
- VectorVest Educational Services
- VectorVest OnLine
- VectorVest Options Analyzer
- VectorVest ProGraphics v6.0
- VectorVest ProTrader 7
- VectorVest RealTime Derby Tool
- VectorVest Simulator
- VectorVest Variator
- VectorVest Watchdog
