HOT TOPICS LIST
- MACD
- Fibonacci
- RSI
- Gann
- ADXR
- Stochastics
- Volume
- Triangles
- Futures
- Cycles
- Volatility
- ZIGZAG
- MESA
- Retracement
- Aroon
INDICATORS LIST
LIST OF TOPICS
PRINT THIS ARTICLE
by Chaitali Mohile
The breakout signal of Baker Hughes fails.
Position: N/A
Chaitali Mohile
Active trader in the Indian stock markets since 2003 and a full-time writer. Trading is largely based upon technical analysis.
PRINT THIS ARTICLE
BOLLINGER BANDS
BHI Rally Turns Down
04/30/10 02:17:56 PMby Chaitali Mohile
The breakout signal of Baker Hughes fails.
Position: N/A
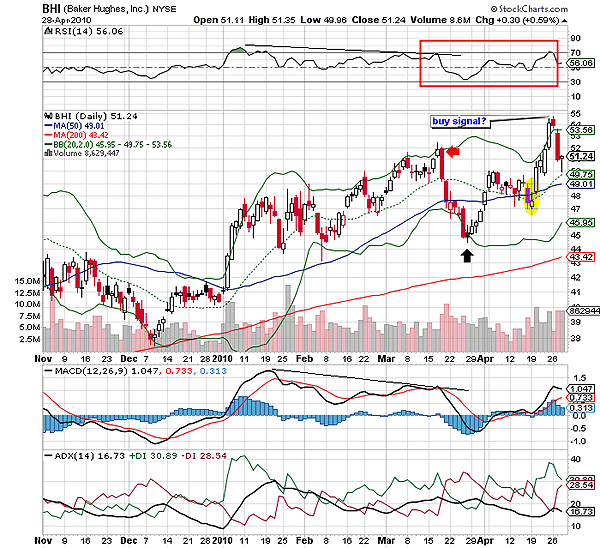
| In a trending market, the Bollinger band can be one of the best tools for trading. The uptrend for Baker Hughes (BHI) has been volatile, but since the price was rallying above the 50-day and the 200-day moving averages (MAs), traders felt confident. In such rallies we can use the Bollinger band (20,2) tool. The lower and the upper lines of the band are the ultimate breakout points in either direction. The center line (dotted) is used as a stop-loss levels by short- and medium-term traders, whereas new traders can use it as a fresh trigger point. In Figure 1, the volatile rallies of BHI have bounced back many times from the bands at both ends. We can see that the price action initiated from the lower band was fueled by bullish strength, reflecting a buy signal for BHI. However, before hitting the upper band, the stock has moved sideways near the center line. Therefore, the breakout of this consolidation range generated fresh buying positions for traders. The consolidation in December 2009 and April 2010 offered a low-risk buy setup. |
| On the other hand, a bearish rally of BHI from the upper band toward the lower was robust and more volatile. But the central line prevented the stock from plunging to the lower band. According to Figure 1, the center line has offered strong support since January 2010 till mid-March. It was only in the second week of March when BHI witnessed a sharp cut of almost $3 in a single trading session (March 18), highlighting a strong sell signal (see red arrow in Figure 1). The following session of March 19 opened below the center line confirming short-selling opportunities. BHI closed below the upper band on March 17 and there was a negative divergence with the relative strength index (RSI) (14) and the moving average convergence/divergence (MACD) (12,26,9) . |

|
| FIGURE 1: BHI, DAILY |
| Graphic provided by: StockCharts.com. |
| |
| Gradually, BHI reached its lower band. The pullback rally began immediately from 45 levels and opened one more buying opportunity. The RSI (14) also signaled a buy by resuming an upward rally from 30 levels. Later, the stock consolidated with the support of the center line. The breakout point (yellow circle) was the buying level for those waiting on the sidelines. The big white bullish candles of the breakout rally signify the strength and possibility of breaching an upper band resistance. BHI closed above the band resistance on April 23, indicating a bullish breakout. However, the RSI (14) formed a double top at 70 levels and diluted the buyer's hopes. BHI underwent a bearish session on Monday, March 26. Currently, the average directional movement index (ADX) (14) is below 20 levels, indicating a weak trend with equal pressure from buyers as well as sellers. The stock has hit the center line; therefore, we need to watch the opening of the next session. If the session begins above the center line, the stop-losses placed by short-sellers would get triggered. The RSI (14) has support at 50 levels, but the weak trend might make short-sellers' pockets heavy. |

|
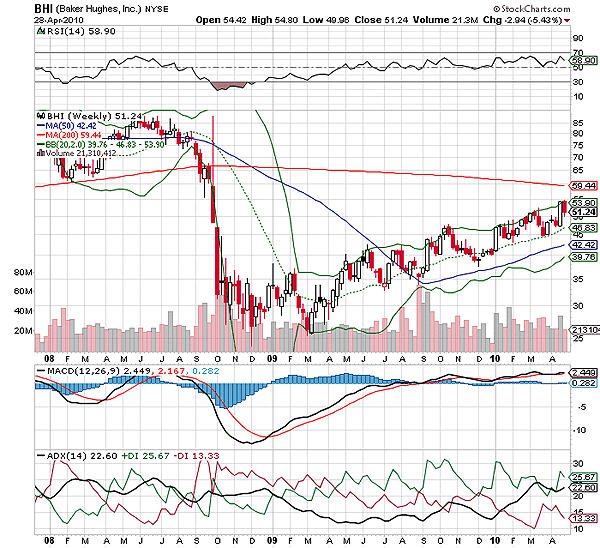
| FIGURE 2: BHI, WEEKLY |
| Graphic provided by: StockCharts.com. |
| |
| In Figure 2, the upward rally from 2009 has moved within the upper band resistance and the center line support. The 50-day MA was another strong support. A similar situation occurred in April. After hitting the upper band, the stock is ready to retest the center line. The ADX (14) is suggesting a developing uptrend, and the MACD (12,26,9) and RSI (14) are shaky in the bullish zones. Therefore, the stock is currently moving in a nontrending zone. Long trades should be initiated with respect to the center line. |
| Considering the history of BHI, price is likely to retrace to 46 levels. Thereafter, traders can strategize their long positions by reviewing the oscillators. This trading system is more suitable for short- or medium-term traders. |
Active trader in the Indian stock markets since 2003 and a full-time writer. Trading is largely based upon technical analysis.
| Company: | Independent |
| Address: | C1/3 Parth Indraprasth Towers. Vastrapur |
| Ahmedabad, Guj 380015 | |
| E-mail address: | chaitalimohile@yahoo.co.in |
Traders' Resource Links | |
| Independent has not added any product or service information to TRADERS' RESOURCE. | |
Click here for more information about our publications!
PRINT THIS ARTICLE

Request Information From Our Sponsors
- StockCharts.com, Inc.
- Candle Patterns
- Candlestick Charting Explained
- Intermarket Technical Analysis
- John Murphy on Chart Analysis
- John Murphy's Chart Pattern Recognition
- John Murphy's Market Message
- MurphyExplainsMarketAnalysis-Intermarket Analysis
- MurphyExplainsMarketAnalysis-Visual Analysis
- StockCharts.com
- Technical Analysis of the Financial Markets
- The Visual Investor
- VectorVest, Inc.
- Executive Premier Workshop
- One-Day Options Course
- OptionsPro
- Retirement Income Workshop
- Sure-Fire Trading Systems (VectorVest, Inc.)
- Trading as a Business Workshop
- VectorVest 7 EOD
- VectorVest 7 RealTime/IntraDay
- VectorVest AutoTester
- VectorVest Educational Services
- VectorVest OnLine
- VectorVest Options Analyzer
- VectorVest ProGraphics v6.0
- VectorVest ProTrader 7
- VectorVest RealTime Derby Tool
- VectorVest Simulator
- VectorVest Variator
- VectorVest Watchdog
