HOT TOPICS LIST
- MACD
- Fibonacci
- RSI
- Gann
- ADXR
- Stochastics
- Volume
- Triangles
- Futures
- Cycles
- Volatility
- ZIGZAG
- MESA
- Retracement
- Aroon
INDICATORS LIST
LIST OF TOPICS
PRINT THIS ARTICLE
by Ron Walker
The directional movement indicator recently flashed a sell signal on the S&P 500. Savvy traders can use the extreme point rule to find the precise entry point to act upon.
Position: N/A
Ron Walker
Ron Walker is an active trader and technical analyst. He operates an educational website dedicated to the study of Technical Analysis. The website offers free market analysis with daily video presentations and written commentaries. Ron is a video pioneer, being one of the first to utilize the internet producing Technical Analysis videos. His website is thechartpatterntrader.com
PRINT THIS ARTICLE
TRADING SYSTEMS
The Extreme Point Rule Triggers The Trade
04/29/10 12:16:00 PMby Ron Walker
The directional movement indicator recently flashed a sell signal on the S&P 500. Savvy traders can use the extreme point rule to find the precise entry point to act upon.
Position: N/A
| The directional movement indicator is a powerful tool for spotting shifts in market momentum. A buy signal is given when the positive directional indicator (+DI) crosses above the negative directional indicator (-DI), and conversely, when the negative directional indicator crosses above the positive directional indicator, a sell signal is generated. When the market is trendless, the DI lines crisscross back and forth, which can generate false signals. Further, following the +DI and -DI cross signals by themselves can lead to whipsaws and overtrading. Steve Achelis offers a solution to this problem using the "extreme point rule" in his book, Technical Analysis From A To Z. Achelis points to the creator of the directional movement system, J. Welles Wilder, and his simple trading rule, to help prevent whipsaws and reduce the number of signals upon which a trader acts. |
| The extreme point rule requires a trader to mark the extreme price point in the day during which the +DI and -DI cross. According to Achelis, the extreme point is the highest point of a session when +DI crosses above -DI and is the lowest point of the session when -DI crosses above +DI. Buy or sell signals are triggered when prices move beyond the extreme point. |

|
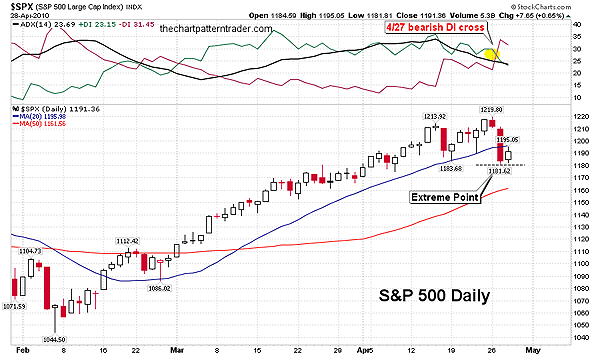
| FIGURE 1: $SPX, DAILY. When -DI crossed above +DI on April 27 (highlighted in yellow), it put traders on notice to watch for a confirmation using the extreme point rule. A move beyond the extreme point of 1181 will be used as a trigger point to implement the trade. |
| Graphic provided by: StockCharts.com. |
| |
| In Figure 1, a sell signal was generated on the Standard & Poor's 500 ($SPX) on April 27, when the negative directional indicator (-DI) crossed above the positive directional indicator (+DI). Using the extreme point methodology, note the extreme low made during that session of 1181.62. That is the entry target for a short position on any instrument or exchange traded fund (ETF) that has parity with the S&P 500 such as the SPDRs (SPY) or going long on the short S&P 500 ProShares (SH). This ETF provides a way to short the S&P 500 without selling SPY short. It is structured to move 100% in the opposite direction of the S&P 500. The extreme point rule is used as a trigger point to implement the trade. In the example shown in Figure 1, the extreme point sell trigger is 1181.62 on the S&P 500. Using this strategy, a trader should wait until prices fall below the extreme point before entering a short position. |

|
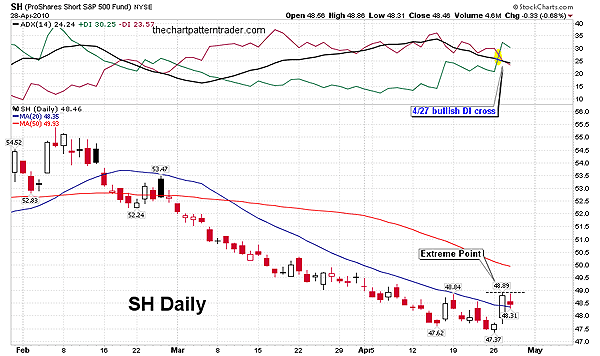
| FIGURE 2: SH, DAILY. The ETF SH moves 100% in the opposite direction of the S&P 500, so here the extreme point is $48.89, which is highest of point of a session when +DI crossed above -DI (highlighted in yellow). |
| Graphic provided by: StockCharts.com. |
| |
| Figure 2 shows the daily chart of SH. Note that it did the opposite of the S&P 500 on April 27 and got a bullish DI cross during the same session that S&P 500 got a bearish cross. SH now needs prices to move above $48.89 in order to trigger the extreme point rule. That means traders should wait until prices move above the extreme point before taking a long position on SH using this trading strategy. |
| Another option is using a confirming close to validate the signals. Often, prices can move beyond the extreme point with an intraday move but fail to close above or below it. This can also lead to whipsaws. Waiting for a confirming close is another way to validate that momentum has shifted. Once prices close beyond the extreme point, the waters are safe for a trader to act upon the buy or sell signal. |
Ron Walker is an active trader and technical analyst. He operates an educational website dedicated to the study of Technical Analysis. The website offers free market analysis with daily video presentations and written commentaries. Ron is a video pioneer, being one of the first to utilize the internet producing Technical Analysis videos. His website is thechartpatterntrader.com
| Website: | thechartpatterntrader.com |
| E-mail address: | thechartpatterntrader@gmail.com |
Click here for more information about our publications!
Comments
Date: 04/30/10Rank: 5Comment:

Request Information From Our Sponsors
- VectorVest, Inc.
- Executive Premier Workshop
- One-Day Options Course
- OptionsPro
- Retirement Income Workshop
- Sure-Fire Trading Systems (VectorVest, Inc.)
- Trading as a Business Workshop
- VectorVest 7 EOD
- VectorVest 7 RealTime/IntraDay
- VectorVest AutoTester
- VectorVest Educational Services
- VectorVest OnLine
- VectorVest Options Analyzer
- VectorVest ProGraphics v6.0
- VectorVest ProTrader 7
- VectorVest RealTime Derby Tool
- VectorVest Simulator
- VectorVest Variator
- VectorVest Watchdog
- StockCharts.com, Inc.
- Candle Patterns
- Candlestick Charting Explained
- Intermarket Technical Analysis
- John Murphy on Chart Analysis
- John Murphy's Chart Pattern Recognition
- John Murphy's Market Message
- MurphyExplainsMarketAnalysis-Intermarket Analysis
- MurphyExplainsMarketAnalysis-Visual Analysis
- StockCharts.com
- Technical Analysis of the Financial Markets
- The Visual Investor
