HOT TOPICS LIST
- MACD
- Fibonacci
- RSI
- Gann
- ADXR
- Stochastics
- Volume
- Triangles
- Futures
- Cycles
- Volatility
- ZIGZAG
- MESA
- Retracement
- Aroon
INDICATORS LIST
LIST OF TOPICS
PRINT THIS ARTICLE
by Chaitali Mohile
Is the Semiconductor Index likely to test the newly formed support or plunge further? Is this corrective rally suitable to trigger fresh long positions?
Position: N/A
Chaitali Mohile
Active trader in the Indian stock markets since 2003 and a full-time writer. Trading is largely based upon technical analysis.
PRINT THIS ARTICLE
GAPS
Semiconductor Index Retracing To New Support?
04/28/10 02:06:58 PMby Chaitali Mohile
Is the Semiconductor Index likely to test the newly formed support or plunge further? Is this corrective rally suitable to trigger fresh long positions?
Position: N/A
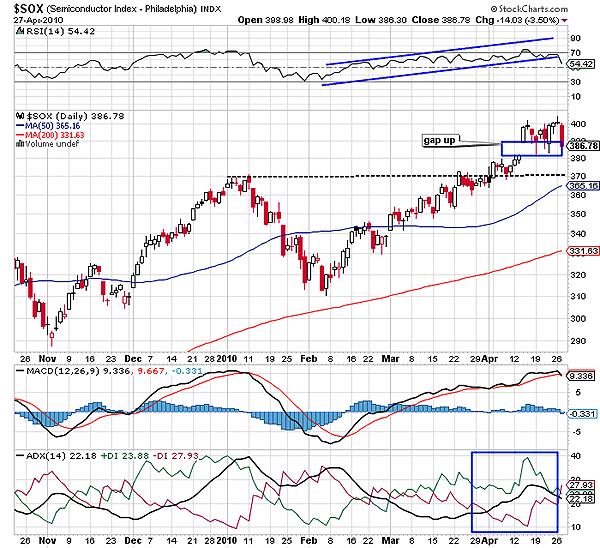
| An intermediate resistance of the Semiconductor Index ($SOX) at 370 levels was breached by fresh bullish notes. The rally that started from 310 had robust bullish strength and the support of the 50-day and 200-day moving averages (MAs). The average directional movement index (ADX) (14) surged above 20 levels with huge buying pressure, suggesting a developing uptrend. The moving average convergence/divergence (MACD)(12,26,9) had already entered the positive territory, indicating bullish momentum in the rally. Thus, the conversion of resistance to support at 370 should be no surprise. A huge gap up in Figure 1 reconfirmed the strength in the rally. We all know that the gaps are unpredictable but their trading strategies can be marked carefully. |

|
| FIGURE 1: $SOX, DAILY. Below the 50-day moving average (MA), $SOX has a major support of the 200-day MA. This long-term MA is determined as a major trend reversal support. |
| Graphic provided by: StockCharts.com. |
| |
| It is important to observe the price movement after the gap up/down. We can see in Figure 1 that $SOX consolidated within the range of 390 and 400. However, $SOX retraced to fill the gap up and generated fresh buying opportunities. The breakout point has to be confirmed by the price action and the oscillator. $SOX has been moving sideways for more than a week. During consolidation, the index tried to cover the gap and rushed toward the upper range resistance. The rally of $SOX seems to be exhausted as the consolidated move is mixed with the doji candlesticks and red bearish candles. The lower level of the gap up was challenged; however, the index has failed to sustain bullish strength. Therefore, I am reluctant to currently open any long positions. The relative strength index (RSI) has slipped below the lower trendline in Figure 1 and is ready to hit the 50 levels. The MACD (12,26,9) is converging with the trigger line in positive territory. Although the indicator does not signal any robust bearish rally, the lower support at 370 levels is likely to get challenged. |
| However, the correction is not likely to drag the indicators into bearish areas. Therefore, you could trigger fresh long positions at the 370 levels after reconfirming the positions of the oscillators. The 50-day MA support is likely to collide with the support line (dotted line) in Figure 1, strengthening the bullish hold at 370 levels. The downfall would fill the gap and would provide a safe entry point. Meanwhile, the current bearish force in $SOX has marginally increased the selling pressure on the developing uptrend, which has to be considered along with the other indicators. |
| The long-term charts of $SOX (weekly and monthly) has strong MA supports and the uptrend is developing as well. Therefore, the index is likely to sustain support at 370 levels in Figure 1 and thereafter would witness a rise in demand. |
Active trader in the Indian stock markets since 2003 and a full-time writer. Trading is largely based upon technical analysis.
| Company: | Independent |
| Address: | C1/3 Parth Indraprasth Towers. Vastrapur |
| Ahmedabad, Guj 380015 | |
| E-mail address: | chaitalimohile@yahoo.co.in |
Traders' Resource Links | |
| Independent has not added any product or service information to TRADERS' RESOURCE. | |
Click here for more information about our publications!
PRINT THIS ARTICLE

Request Information From Our Sponsors
- StockCharts.com, Inc.
- Candle Patterns
- Candlestick Charting Explained
- Intermarket Technical Analysis
- John Murphy on Chart Analysis
- John Murphy's Chart Pattern Recognition
- John Murphy's Market Message
- MurphyExplainsMarketAnalysis-Intermarket Analysis
- MurphyExplainsMarketAnalysis-Visual Analysis
- StockCharts.com
- Technical Analysis of the Financial Markets
- The Visual Investor
- VectorVest, Inc.
- Executive Premier Workshop
- One-Day Options Course
- OptionsPro
- Retirement Income Workshop
- Sure-Fire Trading Systems (VectorVest, Inc.)
- Trading as a Business Workshop
- VectorVest 7 EOD
- VectorVest 7 RealTime/IntraDay
- VectorVest AutoTester
- VectorVest Educational Services
- VectorVest OnLine
- VectorVest Options Analyzer
- VectorVest ProGraphics v6.0
- VectorVest ProTrader 7
- VectorVest RealTime Derby Tool
- VectorVest Simulator
- VectorVest Variator
- VectorVest Watchdog
