HOT TOPICS LIST
- MACD
- Fibonacci
- RSI
- Gann
- ADXR
- Stochastics
- Volume
- Triangles
- Futures
- Cycles
- Volatility
- ZIGZAG
- MESA
- Retracement
- Aroon
INDICATORS LIST
LIST OF TOPICS
PRINT THIS ARTICLE
by James Kupfer
Here is another significant warning of a potential market top indicated by Fibonacci numbers.
Position: Sell
James Kupfer
Mr. Kupfer is a market professional and amateur stock market commentator. Disclosure: It is likely that Mr. Kupfer has or will enter a position in any security he writes about.
PRINT THIS ARTICLE
FIBONACCI
Another Fibonacci Warning?
04/26/10 02:44:25 PMby James Kupfer
Here is another significant warning of a potential market top indicated by Fibonacci numbers.
Position: Sell
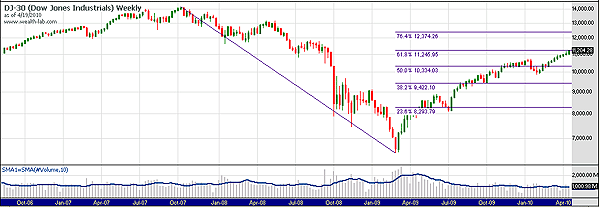
| On Friday, April 23, 2010, the Dow Jones Industrial Average(DJIA) made a new high for the year as did the other major market indexes. The DJIA also reached another significant and not so loudly trumpeted milestone: It closed above the 61.8% Fibonacci retracement level. See Figure 1. |

|
| FIGURE 1: DJIA, WEEKLY |
| Graphic provided by: Wealth-Lab. |
| |
| While the broad market did close above this important Fibonacci level, that in itself does not mean much. It is common for prices to exceed the various Fibonacci levels either up or down before reversing, if indeed prices are going to reverse. Fibonacci levels are not hard and fast, but rather resistance zones where prices are more likely to reverse, at least temporarily, than elsewhere. |
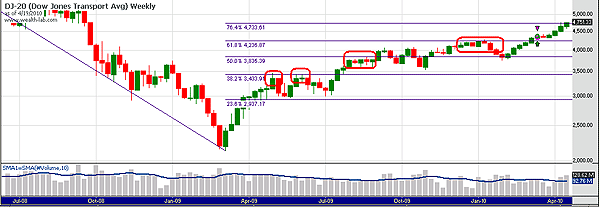
| While the move in the DJIA is significant, it is possibly less significant than the move in the Dow transports (Figure 2). This is because the transports have reached the 76.4% retracement level. A break above this level would mean that the DJ20 as well as the entire broader market were increasingly likely to retrace a significant portion of the moves down from the previous highs. I view this as highly unlikely when considered from a technical perspective. |

|
| FIGURE 2: DJTA, WEEKLY |
| Graphic provided by: Wealth-Lab. |
| |
| It is worthy to note that from a technical perspective the transports have provided a much cleaner technical picture, when considered from a Fibonacci perspective, than has the DJ30. In looking at the retracement levels from the DJ30, it is difficult to discern on a weekly basis where the market paused at any of the major retracement levels. In the transports, however, it is obvious that significant overhead resistance was reached at each of the major resistance levels forecast by using Fibonacci levels. This means we have reached the last important level prior to a full retracement that it is much more important if the bear market is going to have a significant chance to resume at these levels. |
| As laid out in my two previous postings about Fibonacci measurements of the broad market, a massive warning bell is now sounding. The warning is that the broad markets may be ready to resume their downward trends. While it is certainly not a given, that so many Fibonacci markers are lining up at current price levels makes this a logical spot for the market to turn around. |
Mr. Kupfer is a market professional and amateur stock market commentator. Disclosure: It is likely that Mr. Kupfer has or will enter a position in any security he writes about.
Click here for more information about our publications!
PRINT THIS ARTICLE

Request Information From Our Sponsors
- StockCharts.com, Inc.
- Candle Patterns
- Candlestick Charting Explained
- Intermarket Technical Analysis
- John Murphy on Chart Analysis
- John Murphy's Chart Pattern Recognition
- John Murphy's Market Message
- MurphyExplainsMarketAnalysis-Intermarket Analysis
- MurphyExplainsMarketAnalysis-Visual Analysis
- StockCharts.com
- Technical Analysis of the Financial Markets
- The Visual Investor
- VectorVest, Inc.
- Executive Premier Workshop
- One-Day Options Course
- OptionsPro
- Retirement Income Workshop
- Sure-Fire Trading Systems (VectorVest, Inc.)
- Trading as a Business Workshop
- VectorVest 7 EOD
- VectorVest 7 RealTime/IntraDay
- VectorVest AutoTester
- VectorVest Educational Services
- VectorVest OnLine
- VectorVest Options Analyzer
- VectorVest ProGraphics v6.0
- VectorVest ProTrader 7
- VectorVest RealTime Derby Tool
- VectorVest Simulator
- VectorVest Variator
- VectorVest Watchdog
