HOT TOPICS LIST
- MACD
- Fibonacci
- RSI
- Gann
- ADXR
- Stochastics
- Volume
- Triangles
- Futures
- Cycles
- Volatility
- ZIGZAG
- MESA
- Retracement
- Aroon
INDICATORS LIST
LIST OF TOPICS
PRINT THIS ARTICLE
by Donald W. Pendergast, Jr.
The rally continues, with bullish sentiment spilling over market participants who are only too happy to be making back some of 2007–08's bear market losses. But is this party nearly over?
Position: N/A
Donald W. Pendergast, Jr.
Donald W. Pendergast is a financial markets consultant who offers specialized services to stock brokers and high net worth individuals who seek a better bottom line for their portfolios.
PRINT THIS ARTICLE
KELTNER CHANNELS
S&P 500 Near Key Keltner Resistance
04/26/10 10:16:07 AMby Donald W. Pendergast, Jr.
The rally continues, with bullish sentiment spilling over market participants who are only too happy to be making back some of 2007–08's bear market losses. But is this party nearly over?
Position: N/A
| The simple answer is this: maybe, maybe not. All of the broad US stock indexes are on fire, and it makes no sense to attempt to call an exact top here. The market might decide to rise for another month or two for all any of us know, but all we can really do is step back and take a look at the big picture to see what the overall technical picture really looks like. |

|
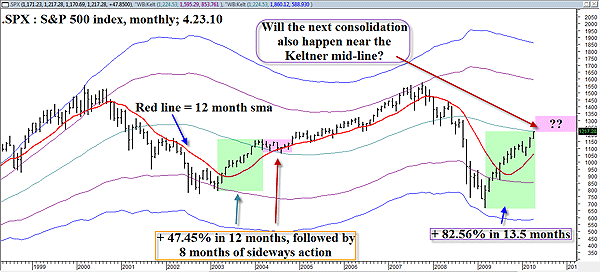
| FIGURE 1: S&P 500, MONTHLY. The incredible rally continues; based on past bull runs however, the odds favor a consolidation sooner rather than later. The resistance area near 1225 to 1250 bear intense scrutiny during the next few weeks and/or months. |
| Graphic provided by: MetaStock. |
| Graphic provided by: WB Keltner bands from Profit Trader for MetaStock. |
| |
| Since making a major low at 666.79 in March 2009, the Standard & Poor's 500 has gained a mind-numbing 550.49 points or about 82.56%, and is also on track to have monthly gains in 11 of the last 14 months (as long as its April close is higher than 1180.69, of course). By way of comparison, coming out of the last bear market low of March 2003, the .SPX "only" managed to tack on 374.34 points in a 12-1/2 month period, or 47.45%. Clearly, this new rally has a lot more firepower cooking beneath it than the first stage of the 2003–07 bull market did. Note that this current run higher out of the March 2009 low launched from a significantly lower price level (666.79 in 2009 versus 788.90 in 2003); the 2008–09 collapse was far more severe on a time/price basis than that of the 2000–03 calamity was. This is a notable fact inasmuch as the index is within a few points of reaching the monthly Keltner band mid-line, a support/resistance (S/R) barrier that will typically serve as either a reversal and/or a consolidation zone. The runs higher in both bull runs are shaded in green; note how the market endured an eight-month period of consolidation (pink shaded box) during 2004, right near the Keltner mid-line. The red line, the 12-month simple moving average (SMA) also helped define the bias of the long-term trend as well. Since even the strongest bull markets need time to pause and digest the accumulated gains, this new rally toward the Keltner mid-line might be considered an early warning that a consolidation and/or reversal may be approaching. Of course, only a fool would attempt to predict just when the turn/pause will occur, but just as a weatherman can make an educated guess as to the most likely kind of storm patterns will emerge during a general time window, taking a look at the big picture in the stock market is a similar endeavor. |
| If you're currently long the market, be sure to run some kind of a trailing stop and if you own questionable equity holdings without an attractive earnings growth projection, consider lightening up on at least a few of them. Some major market analysts still maintain that this massive rally is a bear market rally and not the start of a new bull market; I don't necessarily agree with them, but if they are right, when the next real correction hits, you'll be glad to be out of the market altogether. For now, just see how the S&P 500 reacts near the 1225–50 area in the days/weeks ahead, especially on the daily and weekly charts. Big things may be in store for the US stock market as the spring and summer season progresses. |
Donald W. Pendergast is a financial markets consultant who offers specialized services to stock brokers and high net worth individuals who seek a better bottom line for their portfolios.
| Title: | Writer, market consultant |
| Company: | Linear Trading Systems LLC |
| Jacksonville, FL 32217 | |
| Phone # for sales: | 904-239-9564 |
| E-mail address: | lineartradingsys@gmail.com |
Traders' Resource Links | |
| Linear Trading Systems LLC has not added any product or service information to TRADERS' RESOURCE. | |
Click here for more information about our publications!
PRINT THIS ARTICLE

Request Information From Our Sponsors
- VectorVest, Inc.
- Executive Premier Workshop
- One-Day Options Course
- OptionsPro
- Retirement Income Workshop
- Sure-Fire Trading Systems (VectorVest, Inc.)
- Trading as a Business Workshop
- VectorVest 7 EOD
- VectorVest 7 RealTime/IntraDay
- VectorVest AutoTester
- VectorVest Educational Services
- VectorVest OnLine
- VectorVest Options Analyzer
- VectorVest ProGraphics v6.0
- VectorVest ProTrader 7
- VectorVest RealTime Derby Tool
- VectorVest Simulator
- VectorVest Variator
- VectorVest Watchdog
- StockCharts.com, Inc.
- Candle Patterns
- Candlestick Charting Explained
- Intermarket Technical Analysis
- John Murphy on Chart Analysis
- John Murphy's Chart Pattern Recognition
- John Murphy's Market Message
- MurphyExplainsMarketAnalysis-Intermarket Analysis
- MurphyExplainsMarketAnalysis-Visual Analysis
- StockCharts.com
- Technical Analysis of the Financial Markets
- The Visual Investor
