HOT TOPICS LIST
- MACD
- Fibonacci
- RSI
- Gann
- ADXR
- Stochastics
- Volume
- Triangles
- Futures
- Cycles
- Volatility
- ZIGZAG
- MESA
- Retracement
- Aroon
INDICATORS LIST
LIST OF TOPICS
PRINT THIS ARTICLE
by Chaitali Mohile
The Consumer Discretionary Select Sector is undergoing a healthy bullish rally. The outlook is likely to remain positive.
Position: Hold
Chaitali Mohile
Active trader in the Indian stock markets since 2003 and a full-time writer. Trading is largely based upon technical analysis.
PRINT THIS ARTICLE
TECHNICAL ANALYSIS
Bullish Rally Of XLY
04/26/10 01:37:01 PMby Chaitali Mohile
The Consumer Discretionary Select Sector is undergoing a healthy bullish rally. The outlook is likely to remain positive.
Position: Hold
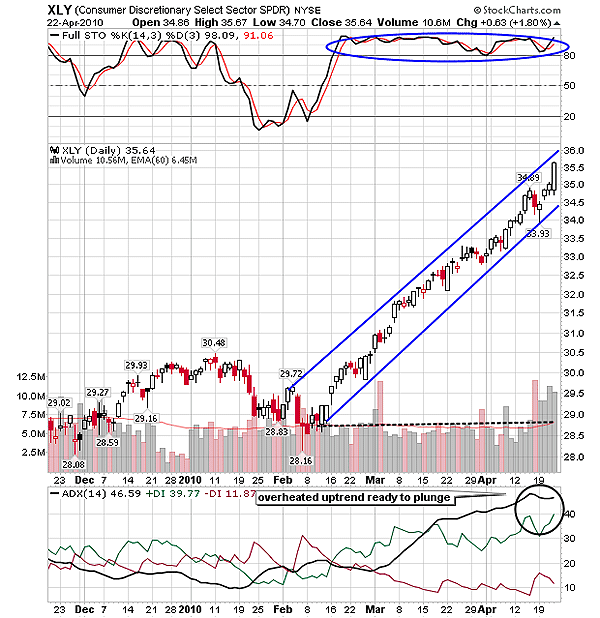
| The Consumer Discretionary Select Sector (XLY) surged with robust strength in February 2010. The steep vertical rally formed an ascending channel. The full stochastic (14,3,3) and average directional movement index (ADX) (14) gradually moved in a bullish zone, indicating a stable rally ahead. On these developing bullish notes, XLY soon reached its historical high of 35 levels. Generally, the single-direction rallies pose little risk as they may reverse at any point in time. At 35 levels, the stochastic oscillator in Figure 1 is highly overbought, and the ADX (14) is suggesting an overheated uptrend. These extreme bullish conditions would have created a bearish rally for XLY. However, XLY is continuing its upward journey within the channel. |

|
| FIGURE 1: XLY, DAILY |
| Graphic provided by: StockCharts.com. |
| |
| In such conditions, traders should keep tight stop-losses to protect their trades. Both indicators are not signaling any downward price action, but relying on them completely would be risky. After breaching an upper trendline in Figure 1, XLY would undergo a bullish breakout. This would be the best buying levels for the fresh buyers, but those already long can continue holding their positions. The lower trendline should be observed as the tight stop-loss for long traders. XLY might plunge to challenge the lower trendline. For maintaining the bullish strength; XLY has to sustain at the lower trendline support. |

|
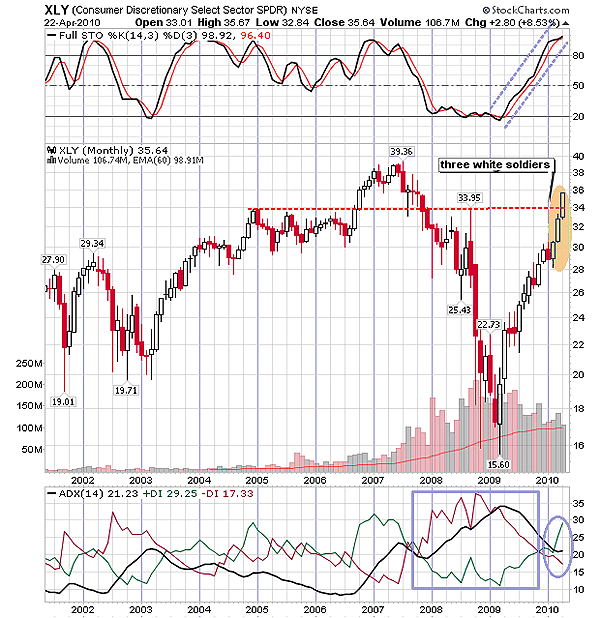
| FIGURE 2: XLY, MONTHLY |
| Graphic provided by: StockCharts.com. |
| |
| Figure 2 is the monthly chart of XLY. Here, the ADX (14) is showing a freshly developing uptrend. We can see ADX (14) plunging from 35 levels in 2009, indicating a trend reversal. Since the downtrend descended from the developed region, the selling pressure shrank. The pullback was initiated due to the declining ADX (14) and an oversold stochastic. A bullish engulfing candlestick pattern confirmed the trend reversal rally. Eventually, XLY reached its previous high resistance at 34. The path from 15.60 to 30 levels was influenced by bulls as well as bears. The three white bullish candles from 30 levels developed a fresh uptrend. The candles in the colored oval in Figure 2 shows the three white soldiers candlestick pattern. |
| The ADX (14) is ready to surge with the support of 20 levels, highlighting the developing uptrend. The stochastic oscillator has also surged in an overbought area above 70 levels. In addition, the three white soldiers is a bullish reversal candlestick pattern. Thus, the long-term view of XLY is bullish and the upward rally is likely to continue its healthy journey. Considering, the developing uptrend on the monthly time frame, the highly overheated uptrend on the daily time frame could hardly damage the bullish sentiments. |
Active trader in the Indian stock markets since 2003 and a full-time writer. Trading is largely based upon technical analysis.
| Company: | Independent |
| Address: | C1/3 Parth Indraprasth Towers. Vastrapur |
| Ahmedabad, Guj 380015 | |
| E-mail address: | chaitalimohile@yahoo.co.in |
Traders' Resource Links | |
| Independent has not added any product or service information to TRADERS' RESOURCE. | |
Click here for more information about our publications!
PRINT THIS ARTICLE

Request Information From Our Sponsors
- VectorVest, Inc.
- Executive Premier Workshop
- One-Day Options Course
- OptionsPro
- Retirement Income Workshop
- Sure-Fire Trading Systems (VectorVest, Inc.)
- Trading as a Business Workshop
- VectorVest 7 EOD
- VectorVest 7 RealTime/IntraDay
- VectorVest AutoTester
- VectorVest Educational Services
- VectorVest OnLine
- VectorVest Options Analyzer
- VectorVest ProGraphics v6.0
- VectorVest ProTrader 7
- VectorVest RealTime Derby Tool
- VectorVest Simulator
- VectorVest Variator
- VectorVest Watchdog
- StockCharts.com, Inc.
- Candle Patterns
- Candlestick Charting Explained
- Intermarket Technical Analysis
- John Murphy on Chart Analysis
- John Murphy's Chart Pattern Recognition
- John Murphy's Market Message
- MurphyExplainsMarketAnalysis-Intermarket Analysis
- MurphyExplainsMarketAnalysis-Visual Analysis
- StockCharts.com
- Technical Analysis of the Financial Markets
- The Visual Investor
