

HOT TOPICS LIST
- MACD
- Fibonacci
- RSI
- Gann
- ADXR
- Stochastics
- Volume
- Triangles
- Futures
- Cycles
- Volatility
- ZIGZAG
- MESA
- Retracement
- Aroon
INDICATORS LIST
LIST OF TOPICS
PRINT THIS ARTICLE
by Sharon Yamanaka
Sometimes there's a lot more going into a candlestick pattern than just the formation.
Position: Buy
Sharon Yamanaka
PRINT THIS ARTICLE
CANDLESTICK CHARTING
Amgen and the Engulfing Pattern
12/20/01 03:07:14 PMby Sharon Yamanaka
Sometimes there's a lot more going into a candlestick pattern than just the formation.
Position: Buy
| Amgen (AMGN) just formed a very bullish engulfing pattern, starting on Friday December14, 2001 and finishing on the16th. The engulfing pattern consists of two candlesticks, the second candle body "engulfing" the first, the open and closing prices being higher and lower than the previous day's. The shadows (day's high and lows) are not relevant to this formation. The engulfing pattern tends to form at peaks in trending stocks, signal a reversal, and has an over 50%, or better-than-a-coin-flip accuracy, overall. For that reason, they are worth investigating when they occur. |
| In the case of Amgen, rumors that they would merge with Immunex began. Initial reaction to the possible merger was that Amgen would pay a large sum of cash, reducing stock holders' dividends and company earnings. The stock price dropped accordingly. Once the announcement was made that Amgen would acquire Immunex, the stock formed the second half of the engulfing pattern, shooting up $5 in one day. This seemed to be because Amgen didn't pay as much as was expected, and the merger was looked upon as a positive move for both companies. Amgen is a biotechnology company that develops and manufactures the drugs Epogen, Neupogen, Infergen and Temgen, used to treat renal failure, myelosuppressive chemotheray, and hepatits C patients, respectively. They also produce Temgen used in stem cell transplantation. Immunex has just produced the drug Embrel, used for treating rheumatoid arthritis. |
|
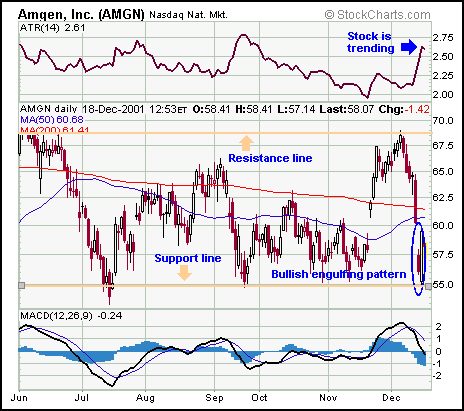
| Figure 1: Six-month chart of AMGN. The top chart shows the average true range; the middle, the daily prices with the recently formed engulfing pattern, and support and resistance lines; the lower two charts are the overbought/oversold indicator MACD and the on-balance volume. |
| Graphic provided by: StockCharts.com. |
| |
| Returning to the technicals, because the engulfing pattern signals a reversal, it needs to be found in a trending stock. For the bullish engulfing pattern, AMGN should be trending downward. Looking at the average true range (ATR) in the top of Figure 1, you can see that the stock is in the upper section of its range, signaling a trend. Further evidence of a reversal is the support line at 55. The second candlestick of the engulfing pattern just touched this line before going upward. The moving average convergence/divergence (MACD) histogram (although not the moving averages) suggests the stock is oversold, possibly a good time to buy. |
| Finally, concluding that the engulfing pattern is signaling a reversal, a resistance line around 68 and the company's own projections, recently amended from 88 to 72 for the upcoming year, give a target price of 70. How soon will that be? The last movement upward for AMGN took one month to go from 55 to 68, and the time before two months to rise from a July low of 50 to high of 66. I would look for a one to two month rise in the stock, depending on the performance of the market at large. The biotechnology sector as a whole seems to be outperforming the larger indexes and has been positive in recent months. |
| Title: | Staff writer |
| Company: | Technical Analysis, Inc. |
| Website: | www.traders.com |
| E-mail address: | syamanaka@traders.com |
Traders' Resource Links | |
| Charting the Stock Market: The Wyckoff Method -- Books | |
| Working-Money.com -- Online Trading Services | |
| Traders.com Advantage -- Online Trading Services | |
| Technical Analysis of Stocks & Commodities -- Publications and Newsletters | |
| Working Money, at Working-Money.com -- Publications and Newsletters | |
| Traders.com Advantage -- Publications and Newsletters | |
| Professional Traders Starter Kit -- Software | |
Click here for more information about our publications!
Comments
Date:�12/29/01Rank:�4Comment:�

Request Information From Our Sponsors
- StockCharts.com, Inc.
- Candle Patterns
- Candlestick Charting Explained
- Intermarket Technical Analysis
- John Murphy on Chart Analysis
- John Murphy's Chart Pattern Recognition
- John Murphy's Market Message
- MurphyExplainsMarketAnalysis-Intermarket Analysis
- MurphyExplainsMarketAnalysis-Visual Analysis
- StockCharts.com
- Technical Analysis of the Financial Markets
- The Visual Investor
- VectorVest, Inc.
- Executive Premier Workshop
- One-Day Options Course
- OptionsPro
- Retirement Income Workshop
- Sure-Fire Trading Systems (VectorVest, Inc.)
- Trading as a Business Workshop
- VectorVest 7 EOD
- VectorVest 7 RealTime/IntraDay
- VectorVest AutoTester
- VectorVest Educational Services
- VectorVest OnLine
- VectorVest Options Analyzer
- VectorVest ProGraphics v6.0
- VectorVest ProTrader 7
- VectorVest RealTime Derby Tool
- VectorVest Simulator
- VectorVest Variator
- VectorVest Watchdog