HOT TOPICS LIST
- MACD
- Fibonacci
- RSI
- Gann
- ADXR
- Stochastics
- Volume
- Triangles
- Futures
- Cycles
- Volatility
- ZIGZAG
- MESA
- Retracement
- Aroon
INDICATORS LIST
LIST OF TOPICS
PRINT THIS ARTICLE
by Donald W. Pendergast, Jr.
Is this the major turn in the broad US markets that many technicians have been forecasting? Let's consider some of the evidence supporting a reversal lower in the Standard & Poor's 500.
Position: Sell
Donald W. Pendergast, Jr.
Donald W. Pendergast is a financial markets consultant who offers specialized services to stock brokers and high net worth individuals who seek a better bottom line for their portfolios.
PRINT THIS ARTICLE
REVERSAL
S&P 500 Topping?
04/23/10 08:32:19 AMby Donald W. Pendergast, Jr.
Is this the major turn in the broad US markets that many technicians have been forecasting? Let's consider some of the evidence supporting a reversal lower in the Standard & Poor's 500.
Position: Sell
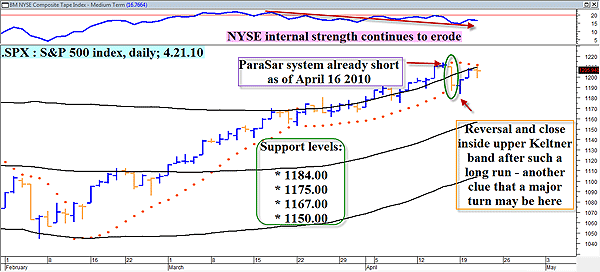
| Every market move comes to an end sooner or later, but as we all learn, sometimes a market can move further and faster (in either direction) than we may anticipate. At other times, the evidence of a significant turn becomes so overwhelming that it would be imprudent to ignore it. We may be at one of those "pay attention" points in the broad US markets right now. The daily chart of the S&P 500 displays plenty of evidence to suggest that the reversal is already underway. See Figure 1. |

|
| FIGURE 1: S&P 500, DAILY. With a Keltner reversal, declining NYSE internal strength, and ParaSar sell signal all in agreement that a turn is all but certain, forward-thinking traders may want to focus on their next moves, keeping an eye on the support levels shown. |
| Graphic provided by: MetaStock. |
| |
| The reversal in the S&P 500 (.SPX, SPY) appears confirmed, based on the confluence of four separate dynamics: 1. The persistent negative divergence of the NYSE internal strength (ratio of advance/declines, up/down volume, new highs/lows, and so on) has finally begun to be confirmed by the recent price action. 2. The index has already triggered a parabolic stop & reverse (ParaSar) system sell as of Friday, April 16, 2010 (see green oval on chart). 3. The simultaneous reversal and then close back inside the upper Keltner band also appears to be a clear repudiation of higher prices by this index. 4. The S&P 500 has risen as much as 16.22% since the February 5, 2010, swing low; combined with the rest of the point already made, this index looks ripe for a drop toward current support levels. Support of various strength can be located in these areas: * 1184.00 * 1175.00 * 1167.00 * 1150.00 Of these four zones, the broad area spanning 1150.00 to 1167.00 is likely going to offer the best chance of a firm footing for the index, should this reversal gather steam. |
| When the S&P 500 makes a trend reversal, you can normally expect to see a move of 4% to 6% (in either direction) before support (resistance) levels begin to stabilize prices. If we see a 5% drop from 1213.92 (last Thursday's high), that would translate into a potential price target of 1153.22, which also happens to be in the area of substantial support. A major weekly cycle low is due within the next three to five weeks, so monitor how fiercely (or gently, as the case may be) this index declines to see if the 1160 to 1150 area will coincide with the anticipated timing of that particular cycle event. |
| There are any number of ways to play a significant trend reversal: 1. Selling short-term, out-of-the-money call options 2. Buying fairly valued (or undervalued) at-the-money put options 3. Shorting the weakest S&P 500 component stocks from the weakest groups 4. Shorting the index itself via the emini SP 500 (ES) futures contract (or its full-sized cousin, the SPX) or the Spyder exchange traded fund (ETF)(SPY). |
| Focus on one of those plans of attack, making sure to limit risk with stop-losses and modest position sizing. You might even want to use some of the previously mentioned support levels as possible target prices for your trades. |
Donald W. Pendergast is a financial markets consultant who offers specialized services to stock brokers and high net worth individuals who seek a better bottom line for their portfolios.
| Title: | Writer, market consultant |
| Company: | Linear Trading Systems LLC |
| Jacksonville, FL 32217 | |
| Phone # for sales: | 904-239-9564 |
| E-mail address: | lineartradingsys@gmail.com |
Traders' Resource Links | |
| Linear Trading Systems LLC has not added any product or service information to TRADERS' RESOURCE. | |
Click here for more information about our publications!
PRINT THIS ARTICLE

Request Information From Our Sponsors
- StockCharts.com, Inc.
- Candle Patterns
- Candlestick Charting Explained
- Intermarket Technical Analysis
- John Murphy on Chart Analysis
- John Murphy's Chart Pattern Recognition
- John Murphy's Market Message
- MurphyExplainsMarketAnalysis-Intermarket Analysis
- MurphyExplainsMarketAnalysis-Visual Analysis
- StockCharts.com
- Technical Analysis of the Financial Markets
- The Visual Investor
- VectorVest, Inc.
- Executive Premier Workshop
- One-Day Options Course
- OptionsPro
- Retirement Income Workshop
- Sure-Fire Trading Systems (VectorVest, Inc.)
- Trading as a Business Workshop
- VectorVest 7 EOD
- VectorVest 7 RealTime/IntraDay
- VectorVest AutoTester
- VectorVest Educational Services
- VectorVest OnLine
- VectorVest Options Analyzer
- VectorVest ProGraphics v6.0
- VectorVest ProTrader 7
- VectorVest RealTime Derby Tool
- VectorVest Simulator
- VectorVest Variator
- VectorVest Watchdog
