HOT TOPICS LIST
- MACD
- Fibonacci
- RSI
- Gann
- ADXR
- Stochastics
- Volume
- Triangles
- Futures
- Cycles
- Volatility
- ZIGZAG
- MESA
- Retracement
- Aroon
INDICATORS LIST
LIST OF TOPICS
PRINT THIS ARTICLE
by Chaitali Mohile
The light crude oil rally has temporarily halted. The temporary bearish rally is likely to create a new buy setup.
Position: Buy
Chaitali Mohile
Active trader in the Indian stock markets since 2003 and a full-time writer. Trading is largely based upon technical analysis.
PRINT THIS ARTICLE
SUPPORT & RESISTANCE
Crude Oil Hits Support
04/23/10 10:31:36 AMby Chaitali Mohile
The light crude oil rally has temporarily halted. The temporary bearish rally is likely to create a new buy setup.
Position: Buy
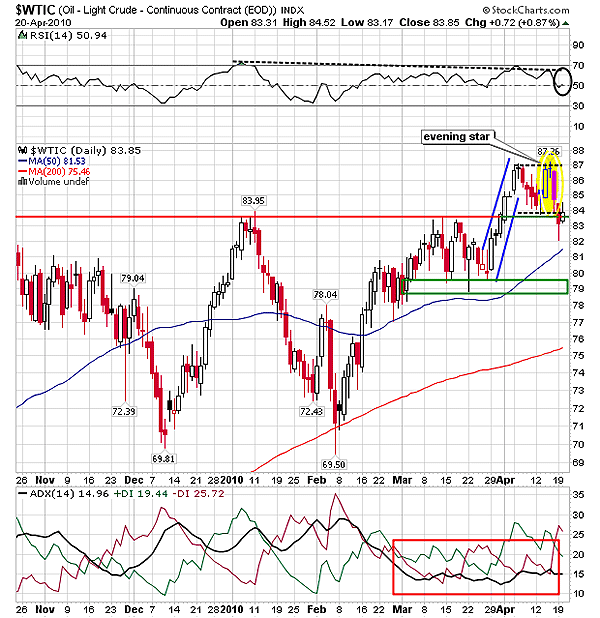
| At $69.50 the Light Crude Oil Index ($WTIC) formed a short-term double-bottom bullish reversal formation. The rally from $69.60 in February 2010 established robust support at the 200-day moving average (MA) and continued its journey. Later, $WTIC violated the 50-day MA resistance. In Figure 1, we can see the average directional movement index (ADX) (14) was pretty shaky. At every fall, the downtrend was developed and vice versa. Between January-February the downtrend was developing, but there was lack of buying pressure, as indicated by the ADX (14) which was dragged below the 15 levels. Therefore, we can see that approaching the previous high resistance at $83.95, $WTIC faced wild volatility and struggled to sustain above resistance. After a small dip, the index surged rapidly, breaching technical resistance at $83.95 levels. Although the ADX (14) indicated weakness in the trend, the rally had tremendous bullish strength. |
| After the prolonged seven-point advance rally, $WTIC consolidated, forming a bullish flag & pennant formation within the $84 and $87 range. A negative divergence of the relative strength index (RSI) (see dotted line) is enough to stir up some uncertainty in the consolidated move. Trading during the consolidation was easier since the range was very wide. The negative divergence diluted the possibility of a bullish breakout for $WTIC. An evening star candlestick pattern in Figure 1 was another bearish reversal indication for the oil index. The price has already plunged below the $84 level; however, the lower side looks very shallow. |

|
| FIGURE 1: $WTIC, DAILY. The index has hit the previous high resistance at $83.95 levels. The next support stands at $81.53. |
| Graphic provided by: StockCharts.com. |
| |
| The index has two strong supports at $83.95 (high pivot) and the 50-day MA at 81.53. In addition, the RSI (14) is likely to establish support at the center line (50 levels). Therefore, this bearish rally would open a fresh buying opportunity for traders. Below $81.53, $WTIC has support at $79, created by the long lower shadows of the previous candlesticks; see the green box in Figure 1. |

|
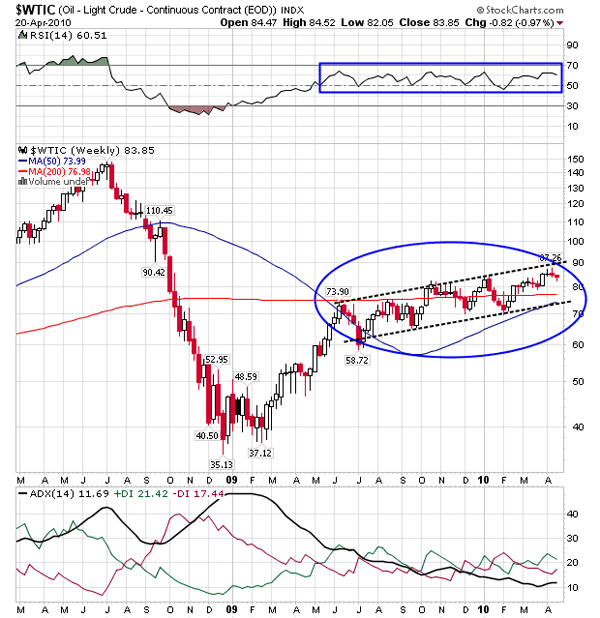
| FIGURE 2: $WTIC, WEEKLY. The index is moving within the ascending channel. The price is ready to retrace at the 200-day MA support. |
| Graphic provided by: StockCharts.com. |
| |
| Since mid-2009, $WTIC has been moving in an ascending range. The index turned highly volatile and the 200-day MA converted from resistance to support. Finally in February 2010, new support at 200-day MA was established. The ADX (14) in Figure 2 has plunged to a weaker section from overheated downtrend levels (above 40 levels). Since $WTIC is rallying above the MAs, the trend is considered bullish. Therefore, a drop in price level has to establish support at 200-day MA. During the entire price rally, the RSI (14) ranged in the 50 to 70 levels, suggesting bullish strength. Considering the current bullish strength, the index is likely to begin a pullback from $80, offering a low-risk buying setup. |
| Thus, this short-term correction in $WTIC is likely to be healthy. |
Active trader in the Indian stock markets since 2003 and a full-time writer. Trading is largely based upon technical analysis.
| Company: | Independent |
| Address: | C1/3 Parth Indraprasth Towers. Vastrapur |
| Ahmedabad, Guj 380015 | |
| E-mail address: | chaitalimohile@yahoo.co.in |
Traders' Resource Links | |
| Independent has not added any product or service information to TRADERS' RESOURCE. | |
Click here for more information about our publications!
PRINT THIS ARTICLE

Request Information From Our Sponsors
- VectorVest, Inc.
- Executive Premier Workshop
- One-Day Options Course
- OptionsPro
- Retirement Income Workshop
- Sure-Fire Trading Systems (VectorVest, Inc.)
- Trading as a Business Workshop
- VectorVest 7 EOD
- VectorVest 7 RealTime/IntraDay
- VectorVest AutoTester
- VectorVest Educational Services
- VectorVest OnLine
- VectorVest Options Analyzer
- VectorVest ProGraphics v6.0
- VectorVest ProTrader 7
- VectorVest RealTime Derby Tool
- VectorVest Simulator
- VectorVest Variator
- VectorVest Watchdog
- StockCharts.com, Inc.
- Candle Patterns
- Candlestick Charting Explained
- Intermarket Technical Analysis
- John Murphy on Chart Analysis
- John Murphy's Chart Pattern Recognition
- John Murphy's Market Message
- MurphyExplainsMarketAnalysis-Intermarket Analysis
- MurphyExplainsMarketAnalysis-Visual Analysis
- StockCharts.com
- Technical Analysis of the Financial Markets
- The Visual Investor
