HOT TOPICS LIST
- MACD
- Fibonacci
- RSI
- Gann
- ADXR
- Stochastics
- Volume
- Triangles
- Futures
- Cycles
- Volatility
- ZIGZAG
- MESA
- Retracement
- Aroon
INDICATORS LIST
LIST OF TOPICS
PRINT THIS ARTICLE
by James Kupfer
Fibonacci fans can be powerful tools to identify potential resistance points, and one looms on the DJ30.
Position: Sell
James Kupfer
Mr. Kupfer is a market professional and amateur stock market commentator. Disclosure: It is likely that Mr. Kupfer has or will enter a position in any security he writes about.
PRINT THIS ARTICLE
FIBONACCI
A Fibonacci Fan Warning
04/20/10 08:45:16 AMby James Kupfer
Fibonacci fans can be powerful tools to identify potential resistance points, and one looms on the DJ30.
Position: Sell
| On March 30, I wrote in my piece "Resistance Levels In Trending Markets" that the Dow Jones 30 was trading within a key group of resistance levels forecast using Fibonacci lines. This grouping of prices was from approximately Dow Jones 10,900 to 11,000. |
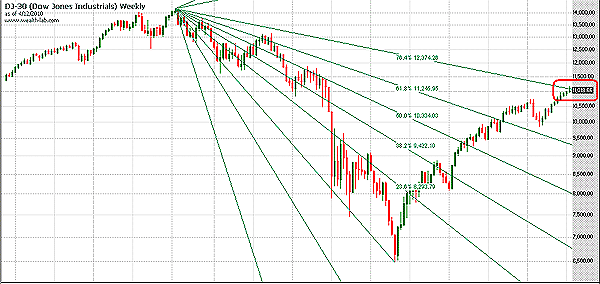
| This is not the only significant price level the broad market has hit predicted by a Fibonacci method. The Fibonacci fan is a commonly used tool for attempting to identify support and resistance levels. Shown in Figure 1 is a Fibonacci fan drawn between the all-time market high above 14,000 and the 2009 market low at 6,500. |

|
| FIGURE 1: DJ 30, WEEKLY. And here's a Fibonacci fan. |
| Graphic provided by: Wealth-Lab. |
| |
| You can see that the Dow Jones 30 broke through all the resistance zones identified by the fan method. However, it did at least have short-term price breaks at the 38.2% and 61.8% levels. Now, the DJ 30 has run into the less-commonly utilized 76.4% level. Note that the market went slightly above the line but closed below it, which so far is a price failure. |
| Normally, this fan level might not hold much predictive weight. However, given that it coincides with a previous warning provided by the Fibonacci retracement levels, the resistance zone tends to be stronger. In all likelihood, this bull move of the previous year is just a bear market bounce. If so, then the convergence of these Fibonacci resistance levels would provide a logical point for the market to turn back down into the next leg of the bear. |
Mr. Kupfer is a market professional and amateur stock market commentator. Disclosure: It is likely that Mr. Kupfer has or will enter a position in any security he writes about.
Click here for more information about our publications!
Comments

Request Information From Our Sponsors
- StockCharts.com, Inc.
- Candle Patterns
- Candlestick Charting Explained
- Intermarket Technical Analysis
- John Murphy on Chart Analysis
- John Murphy's Chart Pattern Recognition
- John Murphy's Market Message
- MurphyExplainsMarketAnalysis-Intermarket Analysis
- MurphyExplainsMarketAnalysis-Visual Analysis
- StockCharts.com
- Technical Analysis of the Financial Markets
- The Visual Investor
- VectorVest, Inc.
- Executive Premier Workshop
- One-Day Options Course
- OptionsPro
- Retirement Income Workshop
- Sure-Fire Trading Systems (VectorVest, Inc.)
- Trading as a Business Workshop
- VectorVest 7 EOD
- VectorVest 7 RealTime/IntraDay
- VectorVest AutoTester
- VectorVest Educational Services
- VectorVest OnLine
- VectorVest Options Analyzer
- VectorVest ProGraphics v6.0
- VectorVest ProTrader 7
- VectorVest RealTime Derby Tool
- VectorVest Simulator
- VectorVest Variator
- VectorVest Watchdog
