HOT TOPICS LIST
- MACD
- Fibonacci
- RSI
- Gann
- ADXR
- Stochastics
- Volume
- Triangles
- Futures
- Cycles
- Volatility
- ZIGZAG
- MESA
- Retracement
- Aroon
INDICATORS LIST
LIST OF TOPICS
PRINT THIS ARTICLE
by Austin Passamonte
Can the Dow Jones Industrial Average sustain a rally past the 10,000 level?
Position: N/A
Austin Passamonte
Austin is a private trader who trades emini stock index futures intraday. He currently trades various futures markets from home in addition to managing a trader's educational forum
PRINT THIS ARTICLE
SUPPORT & RESISTANCE
Climbing Mount 10,000 For The Dow
12/17/01 02:59:18 PMby Austin Passamonte
Can the Dow Jones Industrial Average sustain a rally past the 10,000 level?
Position: N/A
| The Dow Industrials have made an incredible rise of 2,000 index points from the lows in late September to highs in mid-December. No one can dispute the veracity of underlying strength along the way, but how much longer can it last and is there room to run even higher? |
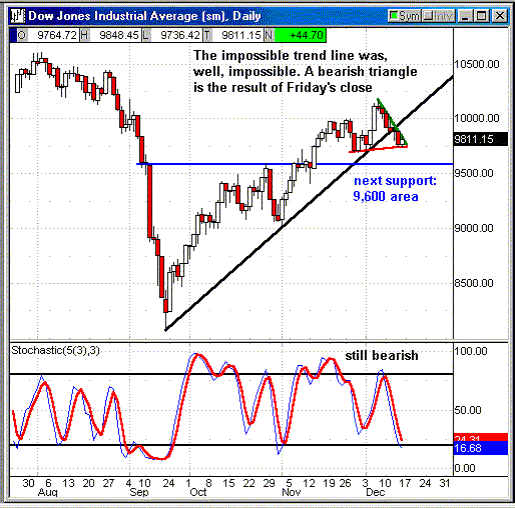
| We've been simply amazed at the parabolic climb so many charts have made with steep trendlines like the Dow's shown here drawn in black. But all that altitude without time to acclimate makes one very dizzy indeed. Us flatlanders recently moved to Denver now hiking the mountain trails at 13,000+ feet can personally attest to this. Now what? |

|
| Figure 1: Daily Chart: Dow |
| Graphic provided by: Quote.com. |
| Graphic provided by: QCharts. |
| |
Well, we have a bearish triangle wedge formed that begs to be broken soon. Upside will find stiff resistance at 10,000 level once more while the first measure of support sits near 9,600 and then every 100 or so points below from there. Stochastic values tried to turn bullish Friday but finished in straight-down fashion for now. Figure 2: Weekly Chart: Dow |
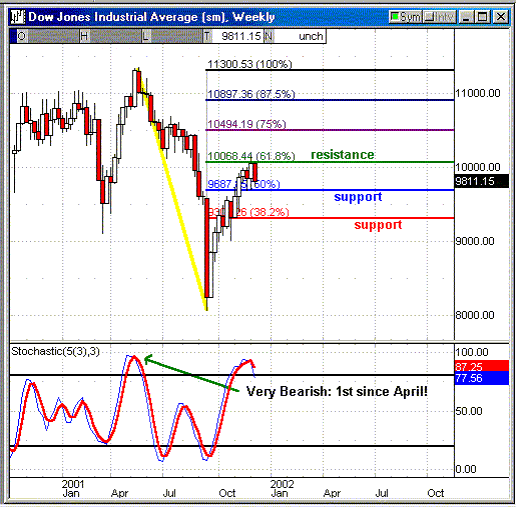
Weekly charts show stochastic values are currently weaker in an overbought extreme than at any point in time since late April 2001. We can easily see what happened after that, and history does have a tendency to repeat. Fibanocci values point out firm support at 9,700 area and well below that near 9,300 should any test of the first measure fail to hold. Will there be a test real soon? No one can guarantee anything, but at least we know crucial pivot points in the market where support may be bought or sold as it manages or fails to hold accordingly. Figure 2: Daily Chart: Dow |
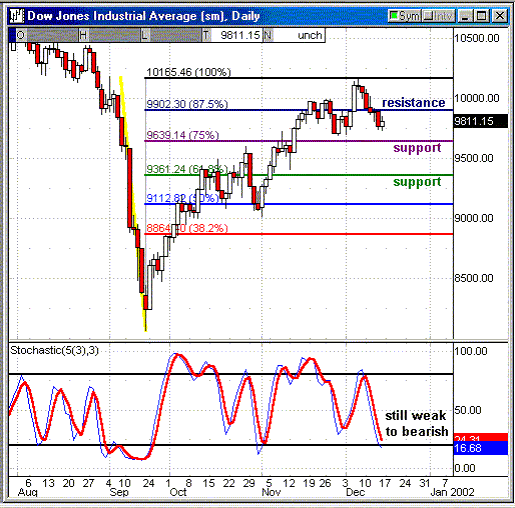
| Dialing down that weekly chart to daily time frame gives tighter points of reference to watch. Looks like 9,900 may offer more bumps on the bullish noggin while 9,640 and especially 9,360 areas should offer solid support. Up or down makes little difference to short-term traders when timing markets. Which way next is all we care about and with price action stuck between these measures of resistance and support it is a simple matter to aptly play the bounces or breaks accordingly! |
Austin is a private trader who trades emini stock index futures intraday. He currently trades various futures markets from home in addition to managing a trader's educational forum
| Title: | Individual Trader |
| Company: | CoiledMarkets.com |
| Address: | PO Box 633 |
| Naples, NY 14512 | |
| Website: | coiledmarkets.com/blog |
| E-mail address: | austinp44@yahoo.com |
Traders' Resource Links | |
| CoiledMarkets.com has not added any product or service information to TRADERS' RESOURCE. | |
Click here for more information about our publications!
Comments
Date: 12/17/01Rank: 1Comment:
Date: 12/18/01Rank: 5Comment: xcellent analysis. Quite stimulating to
Date: 12/18/01Rank: 4Comment:
Date: 12/18/01Rank: 5Comment: followups please
Date: 12/18/01Rank: 5Comment:
Date: 12/19/01Rank: 4Comment:
Date: 12/19/01Rank: 5Comment:

Request Information From Our Sponsors
- StockCharts.com, Inc.
- Candle Patterns
- Candlestick Charting Explained
- Intermarket Technical Analysis
- John Murphy on Chart Analysis
- John Murphy's Chart Pattern Recognition
- John Murphy's Market Message
- MurphyExplainsMarketAnalysis-Intermarket Analysis
- MurphyExplainsMarketAnalysis-Visual Analysis
- StockCharts.com
- Technical Analysis of the Financial Markets
- The Visual Investor
- VectorVest, Inc.
- Executive Premier Workshop
- One-Day Options Course
- OptionsPro
- Retirement Income Workshop
- Sure-Fire Trading Systems (VectorVest, Inc.)
- Trading as a Business Workshop
- VectorVest 7 EOD
- VectorVest 7 RealTime/IntraDay
- VectorVest AutoTester
- VectorVest Educational Services
- VectorVest OnLine
- VectorVest Options Analyzer
- VectorVest ProGraphics v6.0
- VectorVest ProTrader 7
- VectorVest RealTime Derby Tool
- VectorVest Simulator
- VectorVest Variator
- VectorVest Watchdog
