HOT TOPICS LIST
- MACD
- Fibonacci
- RSI
- Gann
- ADXR
- Stochastics
- Volume
- Triangles
- Futures
- Cycles
- Volatility
- ZIGZAG
- MESA
- Retracement
- Aroon
INDICATORS LIST
LIST OF TOPICS
PRINT THIS ARTICLE
by Chaitali Mohile
The airlines index is moving in a narrow range.
Position: N/A
Chaitali Mohile
Active trader in the Indian stock markets since 2003 and a full-time writer. Trading is largely based upon technical analysis.
PRINT THIS ARTICLE
WEDGE FORMATIONS
Airlines Index Forms A Wedge
04/16/10 01:18:00 PMby Chaitali Mohile
The airlines index is moving in a narrow range.
Position: N/A
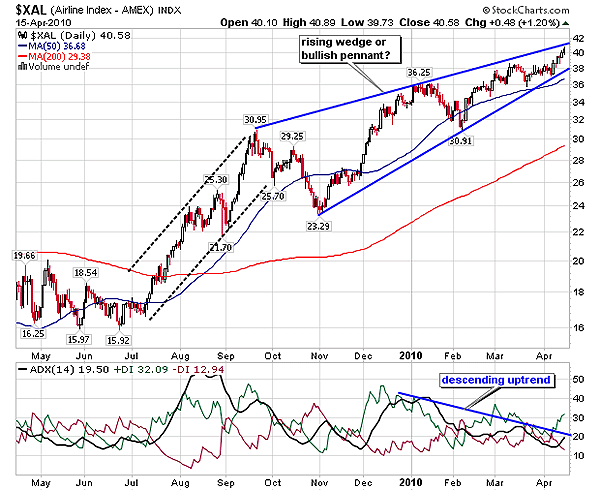
| Figure 1 shows one-year end-of-day data of the airlines index ($XAL). The chart shows an advance rally of 30 points from 15 levels. During the rally, the 50-day and 200-day moving average (MA) resistances were violated. The bullish crossover of the moving averages in Figure 1 is the major bullish signal for $XAL. The 50-day MA has crossed the 200-day MA resistance upward, forming a bullish crossover. After hitting the high at 30 levels, the rally changed direction. The index formed a series of higher highs and higher lows. Initially, the trading range was wider at 30 and 23, enabling traders to enjoy their positions. The rally from 23 levels formed another higher peak at 36. The twists in the price movement of $XAL twisted the selling and buying pressure as well. As a result, the trend in Figure 1 reversed frequently as the selling and buying pressure fluctuated. |
| Frequent change in the direction of the trend creates a wave of uncertainty among traders. In addition, $XAL is a highly sensitive index, so traders should trade very carefully. The narrowing range and trend reversal cause more discomfort while trading. The index kept moving upward and ultimately formed a rising wedge pattern. The two trendlines drawn joining the higher tops and higher bottoms in Figure 1 are converging and are likely to meet at one point. Currently, the range is very narrow, and thus, the pattern has not matured. The bearish breakout appears when the two trendlines coincide. After undergoing many trend reversals, the average directional movement index (ADX) (14) would once again highlight a developing uptrend above 20 levels. This signifies that $XAL would surge toward the upper range of 42 from the lower level at 38. |

|
| FIGURE 1: $XAL, DAILY |
| Graphic provided by: StockCharts.com. |
| |
| If we consider the previous advance rally of 30 points, the rising wedge appears to be a bullish pennant formation. But the uptrend indicated by the ADX (14) is not consistent due to the narrow range. The ADX (14) has descended from the 40 levels to 19 levels. Therefore, we need to stay alert to confirm the breakout direction. The uptrend on the daily time frame is pretty volatile, but the bull trend in weekly and monthly time frames of $XAL is healthy and developing. This bull trend would dominate the breakout on the daily time frame in Figure 1. Thus, the pattern is likely to undergo a bullish breakout. Yet, we need to wait for the confirmed breakout. |
Active trader in the Indian stock markets since 2003 and a full-time writer. Trading is largely based upon technical analysis.
| Company: | Independent |
| Address: | C1/3 Parth Indraprasth Towers. Vastrapur |
| Ahmedabad, Guj 380015 | |
| E-mail address: | chaitalimohile@yahoo.co.in |
Traders' Resource Links | |
| Independent has not added any product or service information to TRADERS' RESOURCE. | |
Click here for more information about our publications!
Comments
Date: 04/20/10Rank: 3Comment:

Request Information From Our Sponsors
- StockCharts.com, Inc.
- Candle Patterns
- Candlestick Charting Explained
- Intermarket Technical Analysis
- John Murphy on Chart Analysis
- John Murphy's Chart Pattern Recognition
- John Murphy's Market Message
- MurphyExplainsMarketAnalysis-Intermarket Analysis
- MurphyExplainsMarketAnalysis-Visual Analysis
- StockCharts.com
- Technical Analysis of the Financial Markets
- The Visual Investor
- VectorVest, Inc.
- Executive Premier Workshop
- One-Day Options Course
- OptionsPro
- Retirement Income Workshop
- Sure-Fire Trading Systems (VectorVest, Inc.)
- Trading as a Business Workshop
- VectorVest 7 EOD
- VectorVest 7 RealTime/IntraDay
- VectorVest AutoTester
- VectorVest Educational Services
- VectorVest OnLine
- VectorVest Options Analyzer
- VectorVest ProGraphics v6.0
- VectorVest ProTrader 7
- VectorVest RealTime Derby Tool
- VectorVest Simulator
- VectorVest Variator
- VectorVest Watchdog
