HOT TOPICS LIST
- MACD
- Fibonacci
- RSI
- Gann
- ADXR
- Stochastics
- Volume
- Triangles
- Futures
- Cycles
- Volatility
- ZIGZAG
- MESA
- Retracement
- Aroon
INDICATORS LIST
LIST OF TOPICS
PRINT THIS ARTICLE
by Chaitali Mohile
In recent days, a few stocks from the gold & silver industry were on the verge of entering a new uptrend. In particular, gold looks promising.
Position: N/A
Chaitali Mohile
Active trader in the Indian stock markets since 2003 and a full-time writer. Trading is largely based upon technical analysis.
PRINT THIS ARTICLE
TECHNICAL ANALYSIS
Gold, A Charming Stock
04/16/10 01:12:56 PMby Chaitali Mohile
In recent days, a few stocks from the gold & silver industry were on the verge of entering a new uptrend. In particular, gold looks promising.
Position: N/A
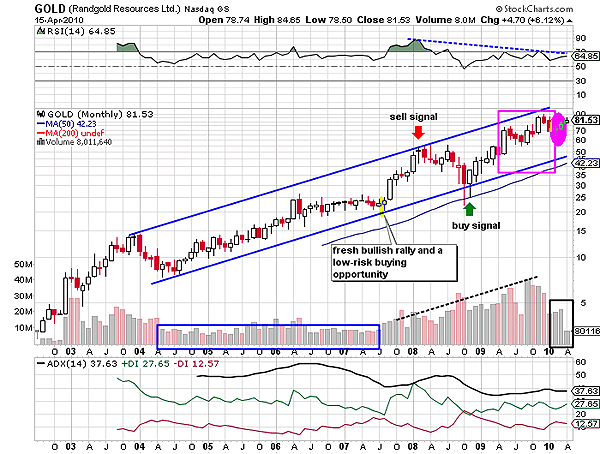
| Rangold Resources (GOLD) has been ascending in a perfect channel on its monthly chart in Figure 1. After a small drop in 2004 from $15, GOLD moved parallel to the lower trendline of the channel. Usually, such price action induces uncertainty among traders as the lower trendline support is likely to come under threat. We can see that the volume in Figure 1 was much lower during this parallel movement of GOLD. However, the relative strength index (RSI) (14) reflected some bullish strength by moving within the overbought region of 50 and 70. Above 60, the RSI (14) is considered to be overbought. The average directional movement index (ADX) (14) was highly overheated in 2006. As you can see, the oversold RSI and overheated ADX were accompanied by a descending run toward the developed trend levels. Thus, GOLD bounced from the support of the lower trendline in July 2008 and triggered a fresh buy setup for traders. Accordingly, the volume sprang and confirmed the stability of the new rally. |

|
| FIGURE 1: GOLD, MONTHLY |
| Graphic provided by: StockCharts.com. |
| |
| Thereafter, GOLD underwent snaky moves within the ascending channel (see the arrows in Figure 1). The ADX (14) comfortably traveled in the developed uptrend area between 30 and 40. But the RSI (14) failed to extend the required strength as it formed lower highs, while GOLD made new highs above 70 levels. Every bullish candle was followed by more than one red bearish candle in 2009. The purple box marked in Figure 1 shows the bullish and bearish candles. This showed an upcoming bearish strength in the rally, however, as the bulls were stronger as the uptrend was rock solid. The negative divergence of the RSI (14) demoralized the bullish sentiment. Although GOLD was not distracted from the path, the speed of the rally diminished. |
| The three small candles -- a black body doji and two bullish candles (see the purple oval) -- highlight decelerating bullish force. Simultaneously, volume shrank as well. But this does not signify that GOLD is likely to reverse the rally or trend. Though the RSI (14) has formed a negative divergence, the oscillator is at 64 levels, indicating bullish strength. The indicator would remain bullish till the support at 50 levels is sustained. In addition, the ADX (14) is suggesting a well-developed uptrend; therefore, GOLD rally is not undergoing any disastrous change. If the rally changes its direction after hitting the upper trendline resistance, the lower trendline of the channel would be the extreme support to prevent any trend reversal movement. Thus, long-term investors can position themselves according to the price movement within the channel. GOLD would be one of the healthy bullish stocks in the basic materials sector and gold & silver industry. |

|
| FIGURE 2: GOLD, DAILY |
| Graphic provided by: StockCharts.com. |
| |
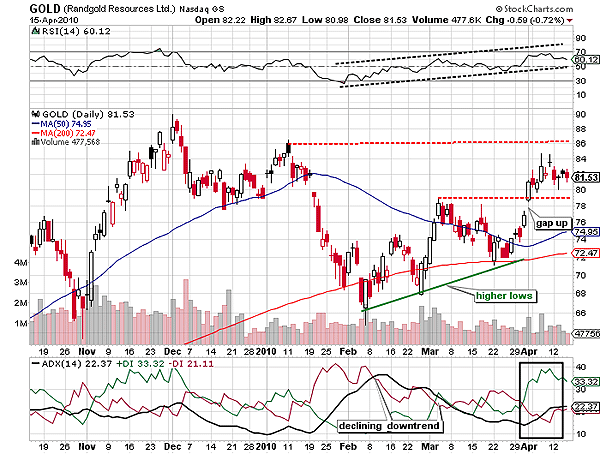
| Figure 3 shows an interesting analysis for the short-term traders, in that $90 was the all-time high of GOLD. Since the uptrend did not develop, see the ADX (14) in November 2009; the stock failed to surge above $90. Thus, a downside move was initiated. The lower high formed with the support of the 50-day moving average (MA) resistance also failed to sustain. As the price breached the 50-day MA support, a new downtrend in Figure 2 was born. This resulted in an additional loss for the rally. The support was violated with a huge gap down of almost two dollars, confirming the bearish force on the daily time frame in Figure 2. GOLD plunged below the 200-day MA support. Since the long-term trend was bullish, the stock could immediately bounce from 64 levels. Thereafter, GOLD formed the series of higher lows, challenging the 200-day MA support. Due to the descending downtrend, GOLD could form the third higher bottom exactly with the MA. |
| Thus, the stock could beat the high pivot at $79 approximately and established robust support. In Figure 2, we can see that GOLD has been consolidating with this support and the resistance at $86 is the next high. The future situation is likely to be bullish range-bound price action with the support-resistance zone of 79 and 86. This range definitely is a good trading opportunity as the ADX (14) is suggesting the developing uptrend and the RSI (14) rallying upward in the proper channel, showing significant bullish strength in the rally. Therefore, this sideways price movement can be traded with the stop-loss below 76 because GOLD may retrace to fill the small gap. For medium-term trades, 50-day MA support would be the final stop-loss. GOLD looks charming among other stocks from the gold & silver industry. |
Active trader in the Indian stock markets since 2003 and a full-time writer. Trading is largely based upon technical analysis.
| Company: | Independent |
| Address: | C1/3 Parth Indraprasth Towers. Vastrapur |
| Ahmedabad, Guj 380015 | |
| E-mail address: | chaitalimohile@yahoo.co.in |
Traders' Resource Links | |
| Independent has not added any product or service information to TRADERS' RESOURCE. | |
Click here for more information about our publications!
Comments

|

Request Information From Our Sponsors
- StockCharts.com, Inc.
- Candle Patterns
- Candlestick Charting Explained
- Intermarket Technical Analysis
- John Murphy on Chart Analysis
- John Murphy's Chart Pattern Recognition
- John Murphy's Market Message
- MurphyExplainsMarketAnalysis-Intermarket Analysis
- MurphyExplainsMarketAnalysis-Visual Analysis
- StockCharts.com
- Technical Analysis of the Financial Markets
- The Visual Investor
- VectorVest, Inc.
- Executive Premier Workshop
- One-Day Options Course
- OptionsPro
- Retirement Income Workshop
- Sure-Fire Trading Systems (VectorVest, Inc.)
- Trading as a Business Workshop
- VectorVest 7 EOD
- VectorVest 7 RealTime/IntraDay
- VectorVest AutoTester
- VectorVest Educational Services
- VectorVest OnLine
- VectorVest Options Analyzer
- VectorVest ProGraphics v6.0
- VectorVest ProTrader 7
- VectorVest RealTime Derby Tool
- VectorVest Simulator
- VectorVest Variator
- VectorVest Watchdog
