HOT TOPICS LIST
- MACD
- Fibonacci
- RSI
- Gann
- ADXR
- Stochastics
- Volume
- Triangles
- Futures
- Cycles
- Volatility
- ZIGZAG
- MESA
- Retracement
- Aroon
INDICATORS LIST
LIST OF TOPICS
PRINT THIS ARTICLE
by Donald W. Pendergast, Jr.
The RMO swing trade system has just issued new sell signals for 18 of the S&P 500 component stocks. Using relative strength analysis, we'll locate the weakest of these potential short sale candidates.
Position: Sell
Donald W. Pendergast, Jr.
Donald W. Pendergast is a financial markets consultant who offers specialized services to stock brokers and high net worth individuals who seek a better bottom line for their portfolios.
PRINT THIS ARTICLE
TRADING SYSTEMS
Jabil Circuit Possible Short Setup
04/16/10 08:59:41 AMby Donald W. Pendergast, Jr.
The RMO swing trade system has just issued new sell signals for 18 of the S&P 500 component stocks. Using relative strength analysis, we'll locate the weakest of these potential short sale candidates.
Position: Sell
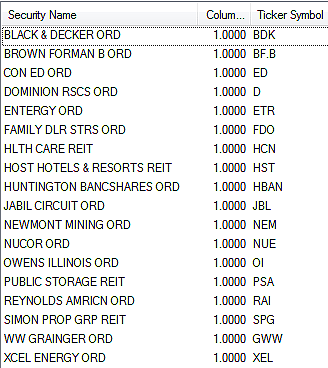
| The Rahul Mohindar oscillator (RMO) trading system comes standard in MetaStock 10 and 11 and can be a real time saver if you need to scan for buy and sell signals in any particular index. In a matter of seconds, MetaStock found 18 stocks that were flashing new sell signals, and with the broad US markets hinting at the onset of a corrective move lower, it might pay to keep close tabs on these stocks, should the correction get underway sooner rather than later. Figure 1 is the raw list of RMO swing sell candidates. |

|
| FIGURE 1: COMPONENT STOCKS. The RMO swing sell signals in the S&P 500 component stocks for April 15, 2010. |
| Graphic provided by: MetaStock. |
| Graphic provided by: MetaStock Explorer. |
| |
| A variety of industry groups are represented here: stocks from the energy, mining, services, technology, real estate, and industrial sectors all make the list. An interesting sidenote here is that there were 21 RMO swing buy signals today in the Standard & Poor's 500, meaning that the broad market is fairly balanced in terms of buys and sells. Tracking the ratio of RMO buys and sells on a daily basis can help give you a bird's-eye view into the inner dynamics of the S&P 500 and can help confirm major trend reversals as they occur. Just look for overwhelmingly lopsided buy or sell numbers over a two- to four-day period, and you'll have an excellent means of confirming reversals such as the one that took place in March 2009. At any rate, our next task is to locate the weakest of those 18 RMO swing sell setups, based on its 13-week rate of change (ROC) calculation versus the S&P 500. |

|
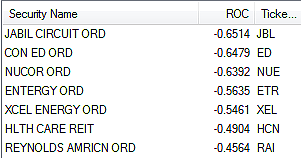
| FIGURE 2: SELL SIGNALS. Of those stocks issuing sell signals, here are the ones that have underperformed the S&P 500 over the past 13 weeks (one calendar quarter). |
| Graphic provided by: MetaStock. |
| Graphic provided by: MetaStock Explorer. |
| |
| And Figure 2 is the result of that MetaStock exploration. Of all the 18 stocks issuing RMO swing sell signals, Jabil Circuits (JBL) has the poorest relative strength versus the broad market index over the last 13 weeks. Now we'll simply pull up a weekly chart of JBL and examine a few technical measures that may help determine if this is a promising short setup. Using the weekly chart can help give us the big picture, which is especially helpful when attempting to short any given stock. See Figure 3. |

|
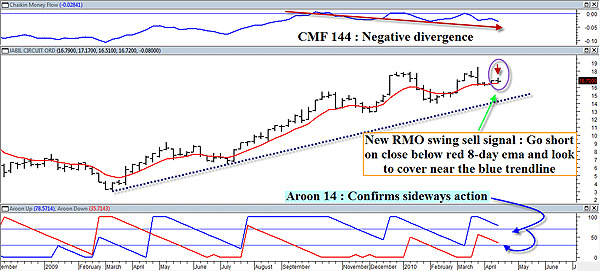
| FIGURE 3: JABIL, WEEKLY. Jabil's weekly chart confirms the lackluster recent price action, and with steadily declining long-term money flow already a done deal, going short under the right conditions might be attractive for adventurous traders. |
| Graphic provided by: MetaStock. |
| |
| Jabil has had a great run since bottoming out in the sub-$5 cellar in March 2009, having nearly increased in value by sixfold as of late March 2010. It's easy to see that the stock is in a sideways, range-bound mode right now, with prices resting just above the eight-week exponential moving average (EMA) and that the stock's long-term Chaikin money flow (CMF)(144) has been manifesting a pronounced negative (bearish) divergence with prices for that past four months or so. In addition, the Aroon (14) trend intensity indicator at the bottom of the chart also confirms the lack of a strong trend at present. All told, this daily RMO swing sell signal might be a decent short setup, but only if you see a daily close below the current value of the eight-week EMA value of $16.48. If you get that, you may want to enter half a short position at the next session's open and then wait for a modest intraday pullback to short the rest of it. I don't like to, nor I normally recommend going short individual stocks (short-squeeze dangers, dividend liabilities, and so forth), but for those with cast-iron stomachs and nerves of steel, once you're filled on this trade, you may want to use that very strong-looking blue uptrend line as your profit target for the trade. Doing so will net you nearly $2 a share profit (if the selloff happens) and provide you with a simple, logical price target that should relieve you of the worry of wondering where to cover and get out of the trade. As far as an initial stop-loss goes, why not just use a buy-stop a couple of ticks above this week's high near $17.17? This still yields a nominal risk-to-reward ratio of nearly 2 to 1 if using the trendline as a profit target. |
| Even if you don't take this short trade, why not track the daily ratio of RMO swing buys and sells in the S&P 500 or NASDAQ 100 indexes and see if it doesn't help you stay on the right side of the market? It might be a venture that's well worth the minimal amount of time and effort involved. |
Donald W. Pendergast is a financial markets consultant who offers specialized services to stock brokers and high net worth individuals who seek a better bottom line for their portfolios.
| Title: | Writer, market consultant |
| Company: | Linear Trading Systems LLC |
| Jacksonville, FL 32217 | |
| Phone # for sales: | 904-239-9564 |
| E-mail address: | lineartradingsys@gmail.com |
Traders' Resource Links | |
| Linear Trading Systems LLC has not added any product or service information to TRADERS' RESOURCE. | |
Click here for more information about our publications!
PRINT THIS ARTICLE

Request Information From Our Sponsors
- StockCharts.com, Inc.
- Candle Patterns
- Candlestick Charting Explained
- Intermarket Technical Analysis
- John Murphy on Chart Analysis
- John Murphy's Chart Pattern Recognition
- John Murphy's Market Message
- MurphyExplainsMarketAnalysis-Intermarket Analysis
- MurphyExplainsMarketAnalysis-Visual Analysis
- StockCharts.com
- Technical Analysis of the Financial Markets
- The Visual Investor
- VectorVest, Inc.
- Executive Premier Workshop
- One-Day Options Course
- OptionsPro
- Retirement Income Workshop
- Sure-Fire Trading Systems (VectorVest, Inc.)
- Trading as a Business Workshop
- VectorVest 7 EOD
- VectorVest 7 RealTime/IntraDay
- VectorVest AutoTester
- VectorVest Educational Services
- VectorVest OnLine
- VectorVest Options Analyzer
- VectorVest ProGraphics v6.0
- VectorVest ProTrader 7
- VectorVest RealTime Derby Tool
- VectorVest Simulator
- VectorVest Variator
- VectorVest Watchdog
