HOT TOPICS LIST
- MACD
- Fibonacci
- RSI
- Gann
- ADXR
- Stochastics
- Volume
- Triangles
- Futures
- Cycles
- Volatility
- ZIGZAG
- MESA
- Retracement
- Aroon
INDICATORS LIST
LIST OF TOPICS
PRINT THIS ARTICLE
by Koos van der Merwe
Obamanomics may be working better than you think.
Position: Sell
Koos van der Merwe
Has been a technical analyst since 1969, and has worked as a futures and options trader with First Financial Futures in Johannesburg, South Africa.
PRINT THIS ARTICLE
ELLIOTT WAVE
Obamanomics And The S&P 500
04/16/10 08:46:15 AMby Koos van der Merwe
Obamanomics may be working better than you think.
Position: Sell
| The polls are saying that the economy is heading down, but the market says that it is back on track. Usually the market is ahead of the economy. Who is correct? What do my updated charts say now that the market has moved very bullish since my last article on this subject on March 19, 2010, "Will The DJIA Reach 11,000?" On April 15, the DJIA was trading at 11140.42, and I was starting to get nervous, looking for that elusive Wave I top and Wave II correction. In this article I will analyze the Standard & Poor's 500 and also discuss a Paget cyclical analysis. |

|
| FIGURE 1: S&P 500, MONTHLY |
| Graphic provided by: AdvancedGET. |
| |
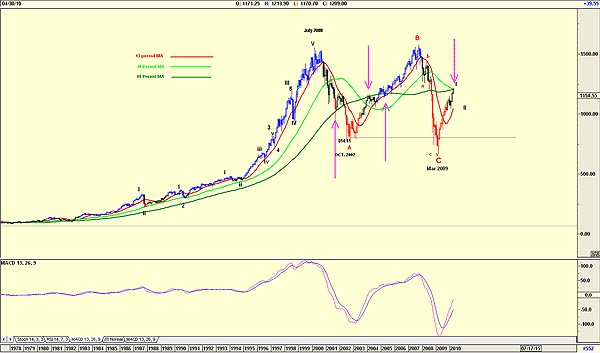
| Figure 1 is a monthly chart of the S&P 500. Note how the index finds resistance at the 80-period moving average as shown by the arrows. The index is currently testing the moving average once again. The weeks and months ahead will determine whether it is once again acting as a resistance level. |

|
| FIGURE 2: S&P 500, DAILY |
| Graphic provided by: AdvancedGET. |
| |
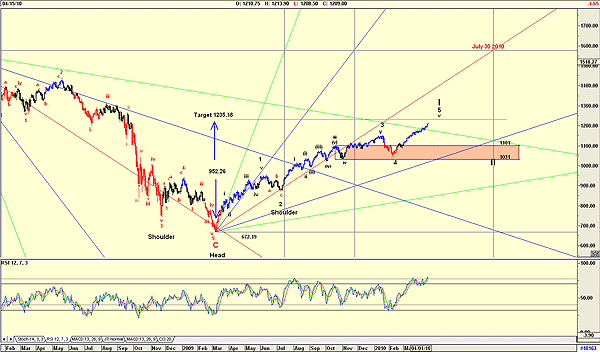
| Figure 2 is a daily chart and shows the inverse head and shoulders pattern with the target of 1235.18. With the present value at 1209 as shown, it is pretty close to its target. This can be confirmed by the relative strength index (RSI), which is at overbought levels, but itself seems confused as to which way the index should move. Do note that the Wave II correction will be to the fourth wave of lesser degree, which means somewhere between 1031 and 1101. |

|
| FIGURE 3: DJIA, CYCLICAL CHART |
| Graphic provided by: AdvancedGET. |
| |
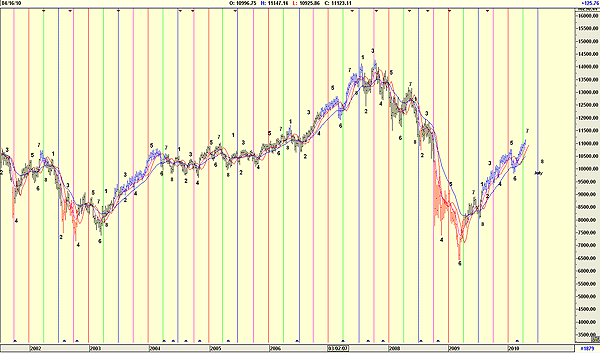
| As for time, here I look at my Paget cycle dates as shown in the weekly chart of the DJIA in Figure 3. Each year is divided in quarters, and the vertical lines repeat themselves. Note the numbers on the chart and how they repeat themselves within the weekly cycle. At present, "7" is suggesting a down correction with "8," sometime in July suggesting a bottom. All these charts suggest that a correction is on the cards once the S&P 500 index reaches or comes close to the 1235.18 level. The Wave II correction, should take it to the 1031–1101 level, would be approximately a 13% retracement. Many bears may say that Obamanomics is not working, but they will be in for a surprise when Wave II is complete. |
Has been a technical analyst since 1969, and has worked as a futures and options trader with First Financial Futures in Johannesburg, South Africa.
| Address: | 3256 West 24th Ave |
| Vancouver, BC | |
| Phone # for sales: | 6042634214 |
| E-mail address: | petroosp@gmail.com |
Click here for more information about our publications!
PRINT THIS ARTICLE

Request Information From Our Sponsors
- StockCharts.com, Inc.
- Candle Patterns
- Candlestick Charting Explained
- Intermarket Technical Analysis
- John Murphy on Chart Analysis
- John Murphy's Chart Pattern Recognition
- John Murphy's Market Message
- MurphyExplainsMarketAnalysis-Intermarket Analysis
- MurphyExplainsMarketAnalysis-Visual Analysis
- StockCharts.com
- Technical Analysis of the Financial Markets
- The Visual Investor
- VectorVest, Inc.
- Executive Premier Workshop
- One-Day Options Course
- OptionsPro
- Retirement Income Workshop
- Sure-Fire Trading Systems (VectorVest, Inc.)
- Trading as a Business Workshop
- VectorVest 7 EOD
- VectorVest 7 RealTime/IntraDay
- VectorVest AutoTester
- VectorVest Educational Services
- VectorVest OnLine
- VectorVest Options Analyzer
- VectorVest ProGraphics v6.0
- VectorVest ProTrader 7
- VectorVest RealTime Derby Tool
- VectorVest Simulator
- VectorVest Variator
- VectorVest Watchdog
