HOT TOPICS LIST
- MACD
- Fibonacci
- RSI
- Gann
- ADXR
- Stochastics
- Volume
- Triangles
- Futures
- Cycles
- Volatility
- ZIGZAG
- MESA
- Retracement
- Aroon
INDICATORS LIST
LIST OF TOPICS
PRINT THIS ARTICLE
by Donald W. Pendergast, Jr.
The Russell 2000 stock index is up by more than 110% since March 2009. Is this jig up?
Position: N/A
Donald W. Pendergast, Jr.
Donald W. Pendergast is a financial markets consultant who offers specialized services to stock brokers and high net worth individuals who seek a better bottom line for their portfolios.
PRINT THIS ARTICLE
CYCLES
Does The Cycle High Approach For the Russell 2000?
04/13/10 11:09:59 AMby Donald W. Pendergast, Jr.
The Russell 2000 stock index is up by more than 110% since March 2009. Is this jig up?
Position: N/A
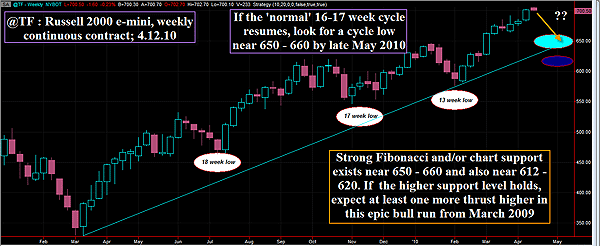
| Springtime bring lots of things: green grass, blooming flowers, bad jokes (what's Irish and comes out in the spring? Paddy O'Furniture, of course!), and, every so often, furious bouts of frantic selloffs in the broad US markets. "Sell in May and go away" is a popular saying among Wall Street types and institutional money managers, and given the incredible rally in the R2K since the bear died in March 2009, might this not be an especially prescient bit of market wisdom? A look at the big picture in the weekly chart of the Russell 2000 index may offer at least a few clues as to what to anticipate next. See Figure 1. |

|
| FIGURE 1: R2K, WEEKLY. Cycles can expand or contract, but over time, the R2K averages about 16 to 17 weeks between major weekly cycle lows. If the next low is on schedule, look for a possible firm low near 650 to 660 by the latter half of May 2010. |
| Graphic provided by: TradeStation. |
| |
| The Russell 2000 small-cap index hit the ground running (after falling down the 2007-09 stock market elevator shaft, so to speak) in early March 2009, and from a low of 329.30 has managed to make it as high as 705.50 (during today's session). That's better than 114% in a 13-month time frame, causing many technicians to wonder just how many bullets this little guy has available. Since 1990, the R2K has managed some astounding percentage moves during both bull and bear phases, so we still need to give this powerful bull market every benefit of the doubt. It may well decide to grind higher still. However, thanks to the art of cycle analysis, we are now witnessing what may be the general area of the top for this February-April 2010 price swing. Typically, over a two-decade period, the R2K averages approximately 16 to 17 weeks between significant swing lows; of the last three complete cycles, the first two were right on schedule, with the more recent low being a bit quick at only 13 weeks (see white ovals on chart). Prices moved smartly higher out of that hole, running all the way from 575.90 to 705.50 in only 9.5 weeks, leaving no doubt at all that this bull is very much alive and kicking. Since we're now in week 10 of the current cycle (measured from major low to major low), the odds favor a near-term top of some kind, followed by some sort of a corrective moveback to retest the last major support area between 650 to 660. If the top for this cycle is already in, then a six- to seven-week period of sideways to lower price action down toward that major support zone might be a likely route for this index to follow. Unexpected news and/or earnings events could also trigger enthusiastic fits of selling, too, especially as the summer months approach. |
| Skilled futures options traders might want to set some margin aside to sell short-term out-of-the-money (OTM) calls or to buy at-the-money puts (ATM), should the Russell 2000 index give reliable signs that this particular cycle top is a wrap. Eventually, this market is going to correct, and seeing as how the R2K loves to do everything in excess, experienced traders stand to make some nice gains once the selling kicks in, whenever that may be. Keep watching the charts and update your cycle counts every week, and you might just be one of those happy traders. And may the luck of the Irish be with you. |
Donald W. Pendergast is a financial markets consultant who offers specialized services to stock brokers and high net worth individuals who seek a better bottom line for their portfolios.
| Title: | Writer, market consultant |
| Company: | Linear Trading Systems LLC |
| Jacksonville, FL 32217 | |
| Phone # for sales: | 904-239-9564 |
| E-mail address: | lineartradingsys@gmail.com |
Traders' Resource Links | |
| Linear Trading Systems LLC has not added any product or service information to TRADERS' RESOURCE. | |
Click here for more information about our publications!
Comments
Date: 04/14/10Rank: 3Comment:

Request Information From Our Sponsors
- VectorVest, Inc.
- Executive Premier Workshop
- One-Day Options Course
- OptionsPro
- Retirement Income Workshop
- Sure-Fire Trading Systems (VectorVest, Inc.)
- Trading as a Business Workshop
- VectorVest 7 EOD
- VectorVest 7 RealTime/IntraDay
- VectorVest AutoTester
- VectorVest Educational Services
- VectorVest OnLine
- VectorVest Options Analyzer
- VectorVest ProGraphics v6.0
- VectorVest ProTrader 7
- VectorVest RealTime Derby Tool
- VectorVest Simulator
- VectorVest Variator
- VectorVest Watchdog
- StockCharts.com, Inc.
- Candle Patterns
- Candlestick Charting Explained
- Intermarket Technical Analysis
- John Murphy on Chart Analysis
- John Murphy's Chart Pattern Recognition
- John Murphy's Market Message
- MurphyExplainsMarketAnalysis-Intermarket Analysis
- MurphyExplainsMarketAnalysis-Visual Analysis
- StockCharts.com
- Technical Analysis of the Financial Markets
- The Visual Investor
